Page 1 of 58
[Non-content page]
Page 2 of 58
Module - 3
Molecular Spectroscopy and Analytical Techniques
SPECTROSCOPY :
It is the branch of science which describes interaction of electromagnetic radiation with matter (ions, atoms, molecules).
Due to the interaction, the spectrum is formed. The spectrum are classified into two :
- Absorption spectrum
- Emission spectrum
ABSORPTION SPECTRUM
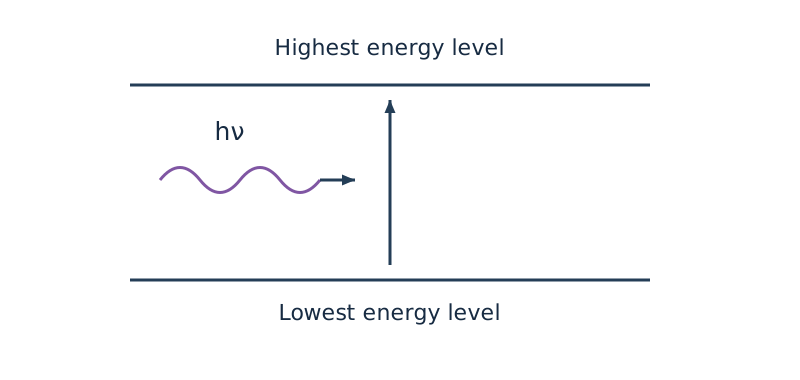
- A molecule undergoes tramition from lowest energy level to highest energy level by absorbing energy from electromagnetic - netic radiation.
- Then absorption spectrum is obtained.
- Eg: UV-visible spectroscopy; InfraRed spectroscopy; NMR spectroscopy.
EMISSION SPECTRUM :
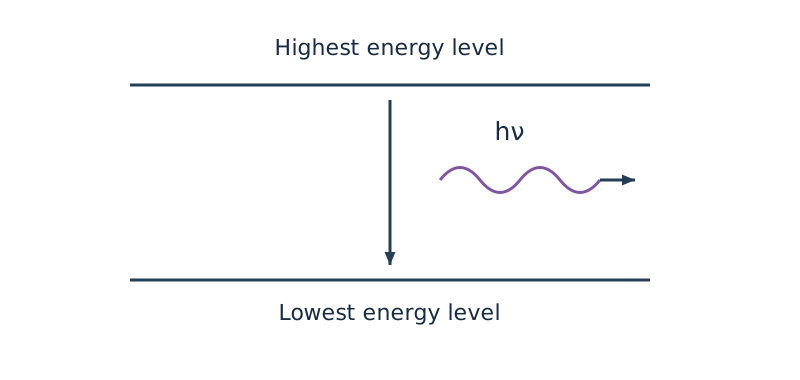
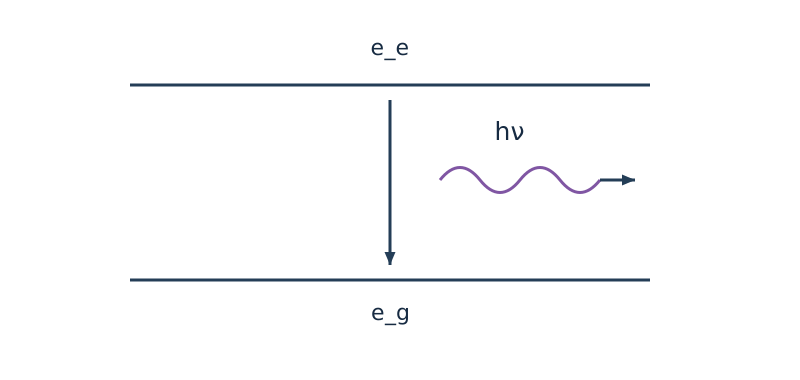
- A molecule undergoes transition from highest energy level to lowest energy level with an emission of energy in the form of photon, then emission opectrum is obtained.
Page 3 of 58
• Eg: Raman Spectroscopy ; Atomic force spectroscopy.
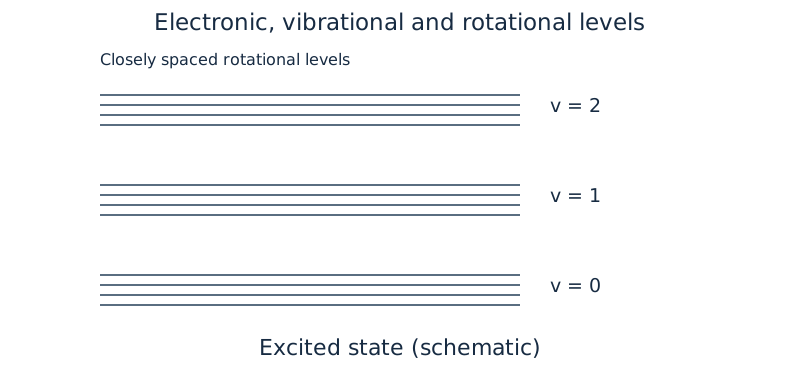
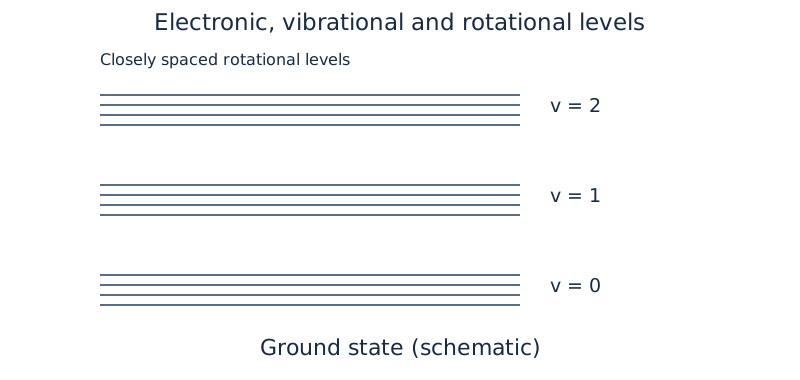
DIFFERENT TYPES OF MOLECULAR ENERGY LEVELS:
- Electronic energy level ()
- Vibrational energy level ()
- Rotational energy level ()
- Translational energy level ()
ELECTRONIC ENERGY LEVEL : ↳ Associated with electrons present in a molecule. ↳ The energy gap between electronic energy level fall in uv-visible region.
VIBRATIONAL ENERGY LEVEL : ↳ Associated with vibrational movement of molecule . ↳ The energy gap between vibrational energy level fall in infra red region.
ROTATIONAL ENERGY LEVEL : ↳ Associated with rotational movement of molecule. ↳ The energy gap between rotational energy level fall in microwave region.
TRANSLATIONAL ENERGY LEVEL : ↳ Associated with translational movement of molecule. ↳ The energy gap between tramolational energy level is considered negligibly small.
• Total energy =
Page 4 of 58
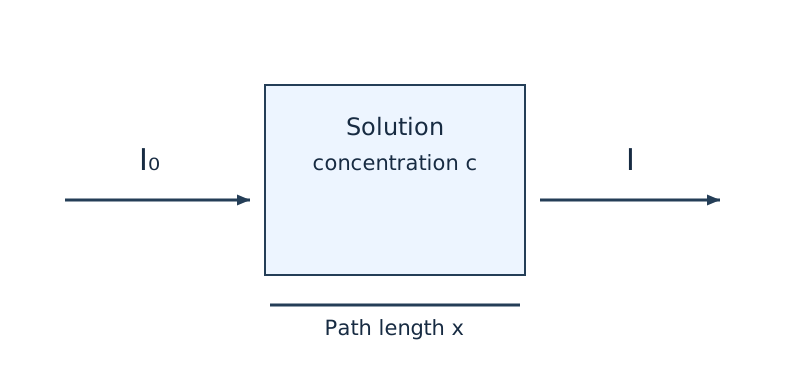
Parameters related to light
Transmittance (T)
Transmittance is the ratio of transmitted-light intensity to incident-light intensity. It has no unit.
Here, is the intensity of transmitted light and is the intensity of incident light.
Absorbance (A)
Absorbance is the logarithm of the ratio of incident-light intensity to transmitted-light intensity. It has no unit.
Beer–Lambert's law
Page 5 of 58
4 The law states that, when a parallel beam of monochromatic electromagnetic radiation is passed through a coloured, dilute and homogeneous solution of known concentration, then absorbance 'A' is directly proportional to concentration of solution and thickness of the medium.
i.e , where
unit of - no unit unit of - (M) unit of -
Q. Define Beer - Lambert's law and deduce integrated form. Discuss the plot of Absorbance versus concentration. What does the slope of the graph represent.
ans.
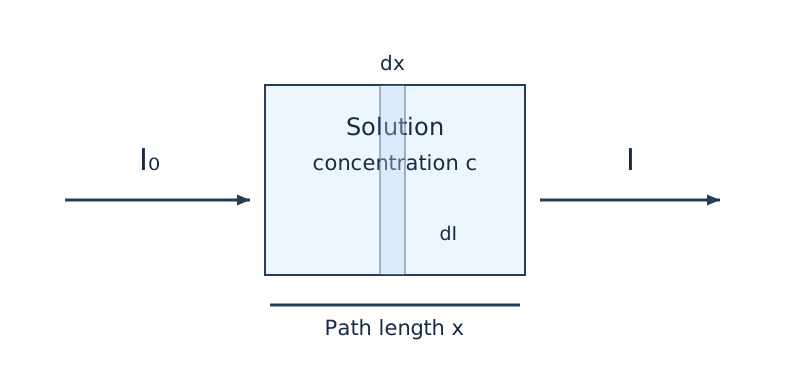
Beer lambert's law states that when a parallel beam of monochromatic electromagnetic radiation is passed through a coloured, dilute and homogeneous solution, the rate of decrease in decrease intensity of radition () with the thickness of sourtion () is directly proportional to intensity of the radiation and concentration of the solution.
Page 6 of 58
i.e.,
where proportionality constant
Integrating both sides,
and
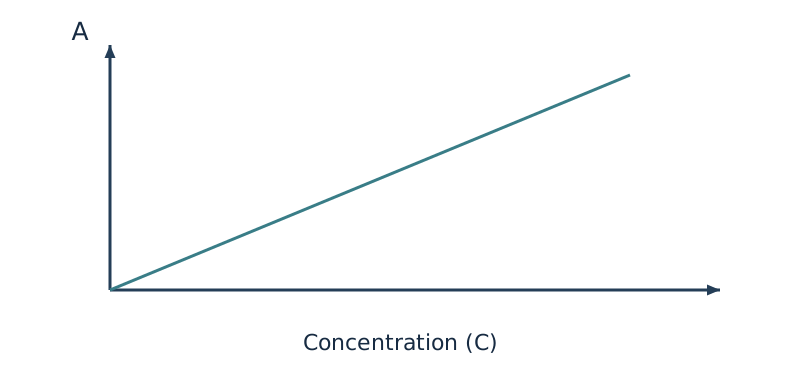
- The plot of absorbance versus concentration should be a straight line passing through the origin for a cell of thickness and slope is given by .
Q. The percentage transmittance of dye solution in ethanol is . In a cell for a light of wavelength . Find the absorbance and molar absorption coefficient.
Ans. Concentration
Thickness
Page 7 of 58
APPLICATIONS OF BEER - LAMBERT'S LAW:
↳ If two solutions of concentration and , where concentration is known and concentration is unknown, then absorbance of both solutions measured under same condition are :
↳ Absorbance is measured in terms of transmittance,
Page 8 of 58
Q. Dye solution of concentration shows absorbance of at while test solution of same dye solution shows absorbance.
Q. A standard solution of after developing red colour with ammonium thiocyanate shows a transmittance of at while an unknown solution of after developing red colour with same amount of ammonium thiocyanate gives a transmittance of . Find the concentration of the unknown solution.
Page 9 of 58
LIMITATIONS OF BEER-LAMBERT'S LAW:
- The law is applicable to only dilute, coloured and homogeneous solution.
- It does not obey, if the light is not monochromatic.
- Deviations may occur, if impurity is present.
- Deviation may occur if temperature varies.
UV - VISIBLE SPECTROSCOPY:
- It is an absorption spectroscopy.
- Principle: UV-visible spectrum or electronic spectrum arises due to transition of electrons from lower energy level to higher energy level by absorbing UV-visible radiation in the range of .
- The two groups which are responsible for UV-visible radiation absorption are chromophore and auxochrome.
CHROMOPHORE:
- It provides colour to a compound.
- It contains unsaturation in their structure ().
AUXOCHROME:
- It does not produce colour, but it can enhance colour of a compound.
- It contains lone pair of electrons in their structure ().
Page 10 of 58
: The wavelength at which maximum absorbance occurs.
Eg: ; ; ;
Page 11 of 58
- transition :
- observed in aldehydes and ketones.
- This transition absorbs radiation in the range of .
- This is a forbidden transition. So the intensity is very low.
- This transition is uv-visible active.
- transition :
- observed in compounds containing nitrogen, oxygen, sulphur.
- This transition absorbs radiation below . This transition is uv-visible inactive.
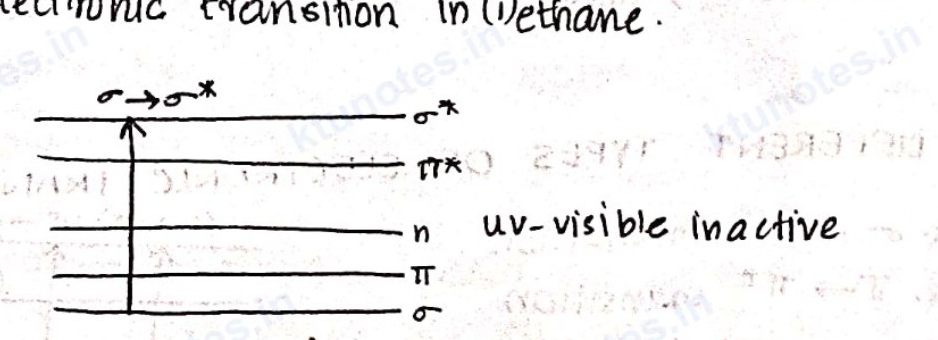
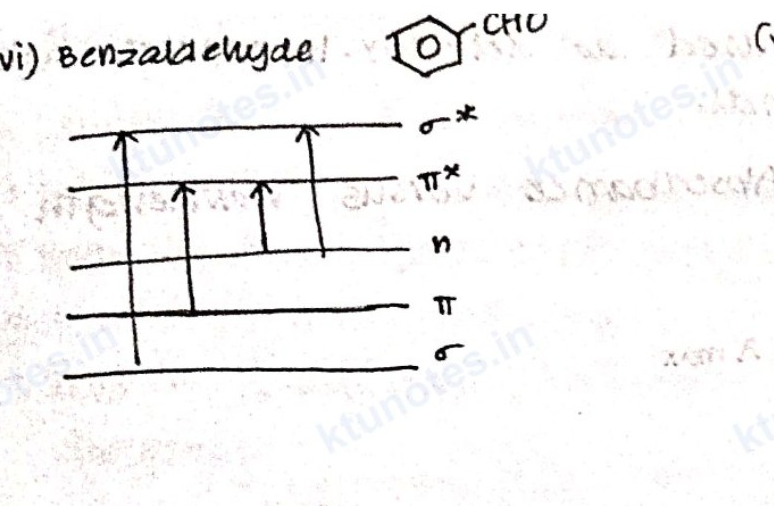
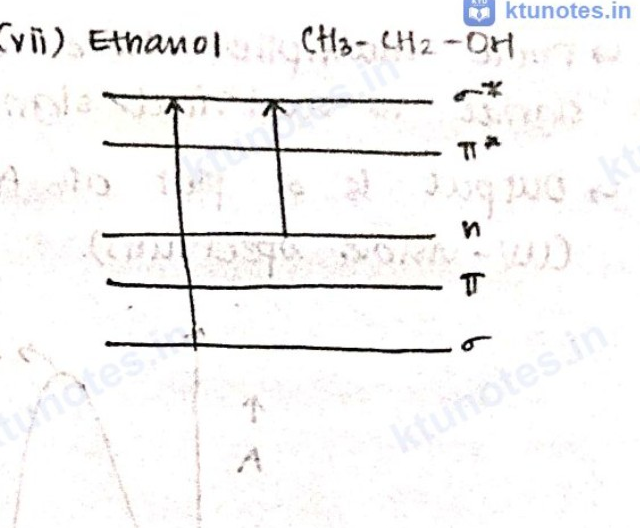
Q. Draw the possible electronic transition in (i) ethane.
Ans. ethane
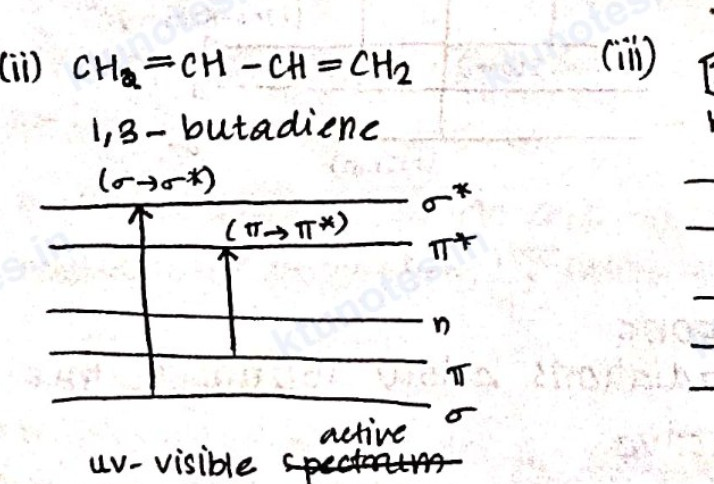
(ii) 1,3-butadiene
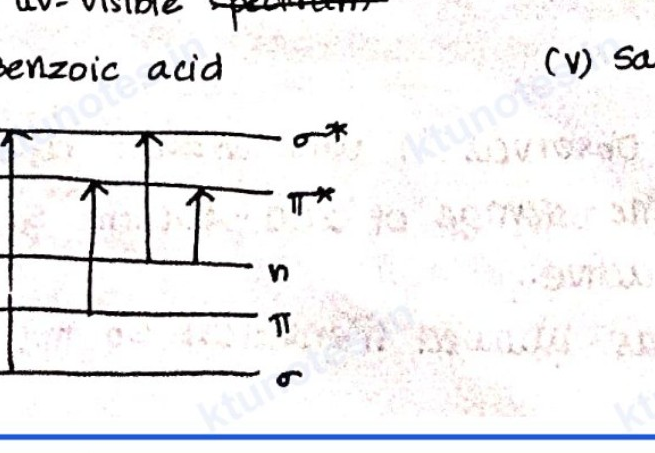
(iv) Benzoic acid
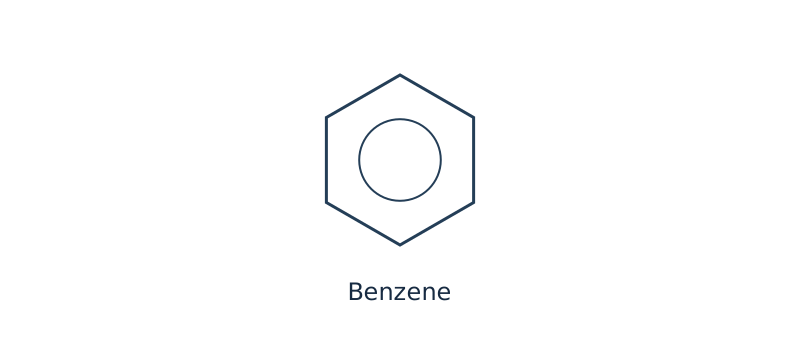
(iii) benzene
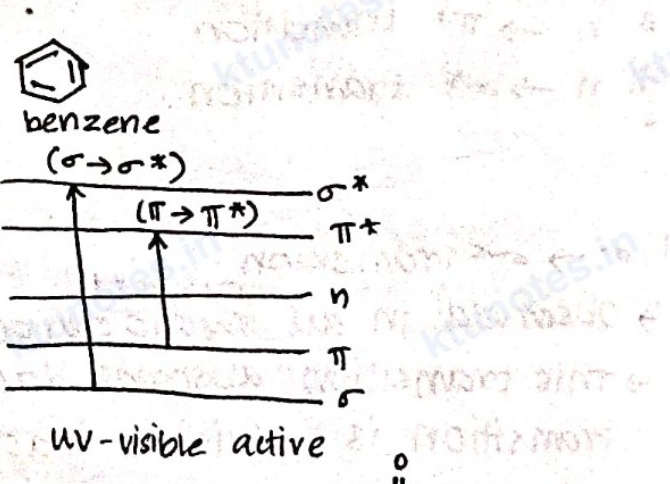
(v) Salicylic acid
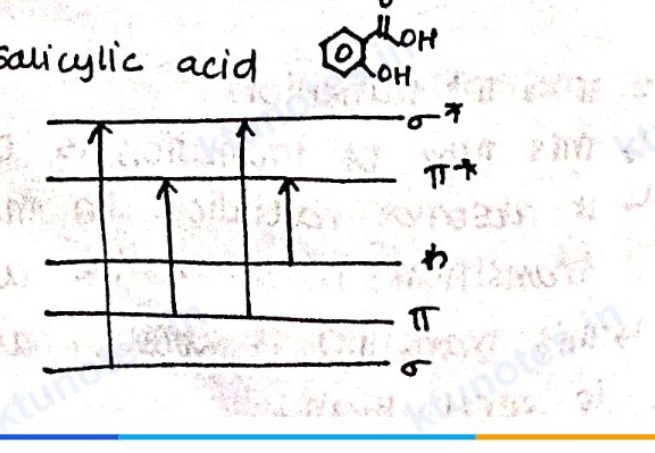
Page 12 of 58
(vi) Benzaldehyde : \text{-CHO}
(vii) Ethanol : \text{CH}_3-\text{CH}_2-\text{OH}
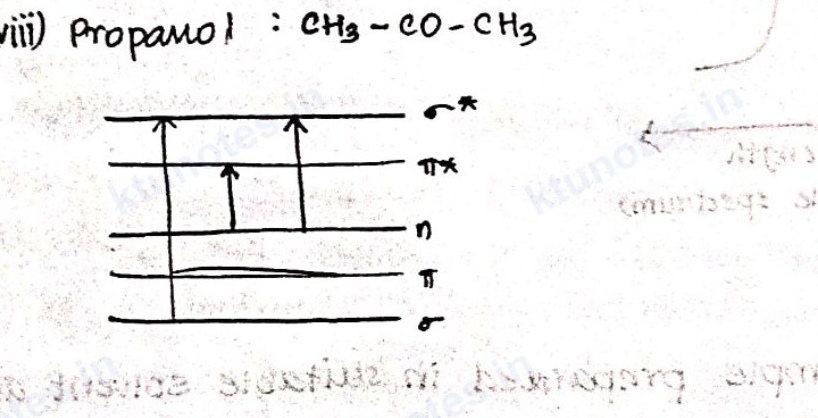
(viii) Propanol : \text{CH}_3-\text{CO}-\text{CH}_3
UV - VISIBLE SPECTROPHOTOMETER:
flowchart LR
S["Source"] --> M["Monochromator"] --> B["Beam splitter"]
B --> R["Reference cell — I₀"]
B --> C["Sample cell — I"]
R --> D["Detector"]
C --> D
D --> O["Output: A = log(I₀/I)"]
- Commonly used sources are H filament lamp, tungsten filament lamp or Xe filament lamp.
- Prism or grating is used as monochromator. It disperses the light into desired wavelength.
- Beam splitter splits wave into two having same intensity.
- Reference cell or sample cell : It is made up of quartz. It must be inert and highly transparent.
Page 13 of 58
↳ Photo multiplier tube used as detector. It converts light signal to electrical signal. ↳ Output is a plot of Absorbance versus wavelength (UV-visible spectrum).
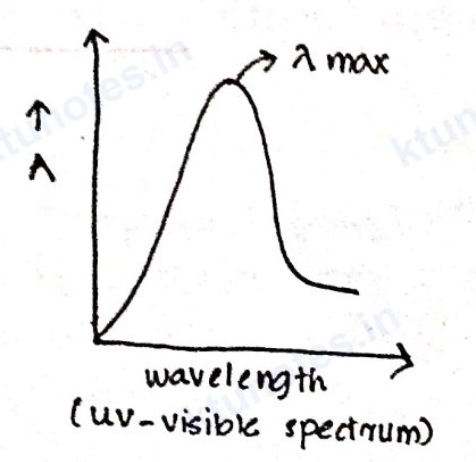
WORKING: ↳ A dilute solution of sample prepared in suitable solvent and taken in a cuvette, which is called sample. A pure solvent taken in another cuvette is called reference. ↳ Source produce UV visible radiation which is allowed to prism, and it makes it monochromatic light. ↳ Beam splitter splits monochromatic light into two beams having same intensity. ↳ One beam is allowed to pass through sample and the other through reference. ↳ Reference doesn't absorb radiation, so intensity of radiation is considered as intensity of incident light. ↳ Sample absorbs radiation, so intensity of radiation is considered as intensity of transmitted light. ↳ Detector detects both radiation and compares. The difference is analysed and recorded. ↳ UV visible spectrum is produced.
Page 14 of 58
APPLICATIONS OF UV-VISIBLE SPECTROSCOPY:
↳ Determination of unknown concentration of a solution. ↳ Determination of unknown compound. ↳ Used to study kinetics of reaction. ↳ Used to characterise dyes. ↳ Used in quantitative estimation of blood sugar and cholestrol.
INFRARED SPECTROSCOPY: ↳ It is an absorption spectrum. ↳ Vibrational spectrum or IR spectrum arises due to transition of a molecule from lower vibrational energy level to higher vibrational energy level by absorbing IR radiation in the range of . ↳ The essential criteria for a molecule to show IR spectrum - dipole moment must change during vibration. ↳ Homonuclear diatomic molecules have no dipole moment, so they are IR inactive. Eg: . ↳ Heteronuclear diatomic or polyatomic molecules have dipole moment, so they are IR active. Eg: .
CALCULATION OF NUMBER OF MODES OF VIBRATION: ↳ For a linear molecule, number of modes of vibration is , where is the number of atoms.
Eg: • carbon dioxide
•
•
Page 15 of 58
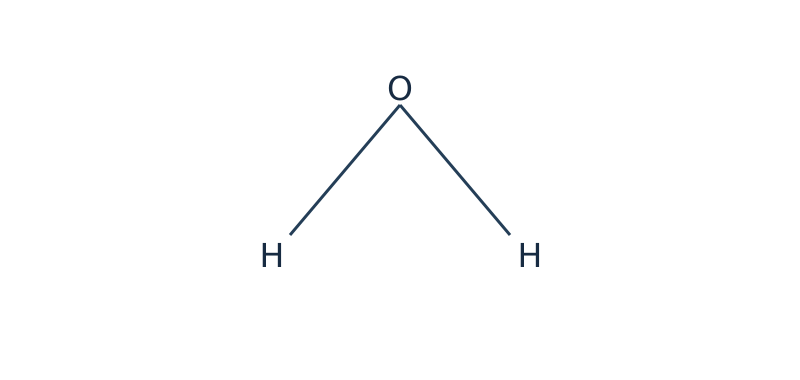
For a non-linear molecule, number of modes of vibration is .
Eg:
Page 16 of 58
- In plane bending vibration :
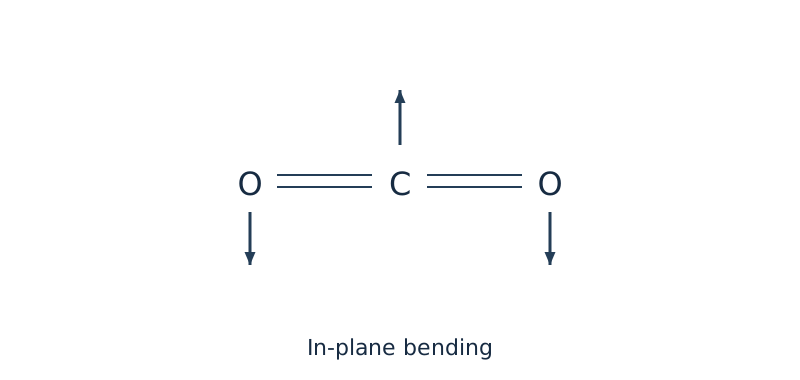
: change in dipole moment IR active.
- Out plane bending vibration :
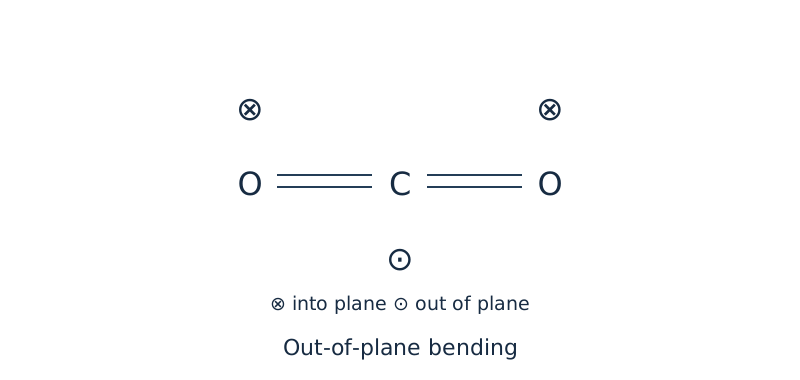
: change in dipole moment IR active.
In , out of 4 vibrations , 3 vibrations are IR active but 2 signals are observed in IR spectrum because in plane and out plane bending vibrations are degenerate (i.e, same energy).
(ii) HCN
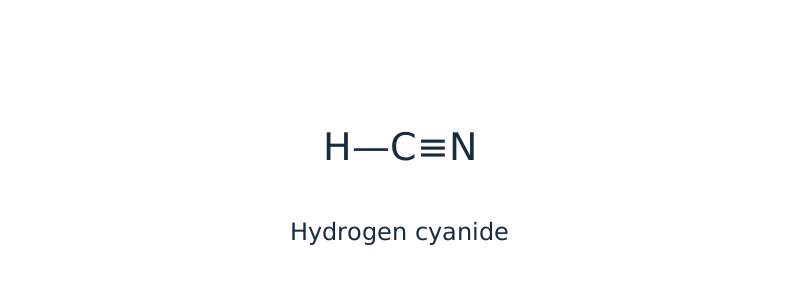
In HCN, four vibrations are IR active.
(iii)
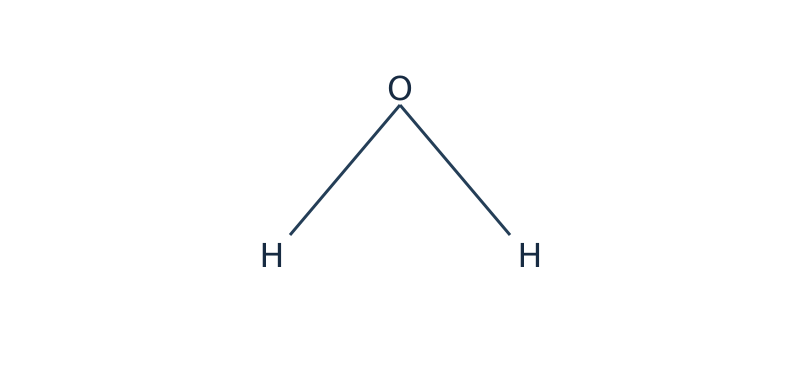
Three vibrations are : symmetric, asymmetric and inplane bending vibrations.
- Symmetric stretching vibration
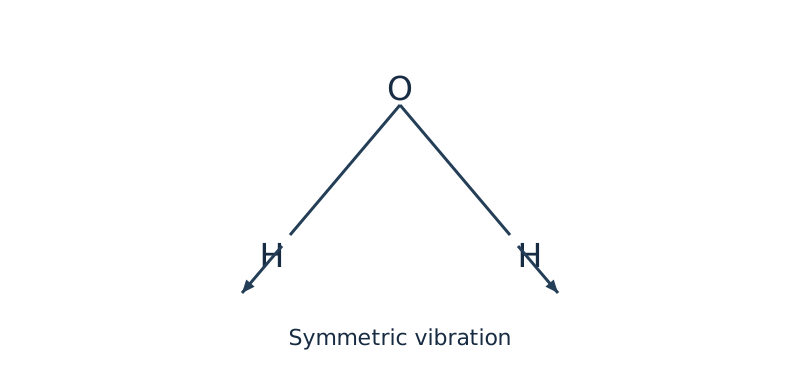
: Change in dipole moment IR active.
- Asymmetric stretching vibration
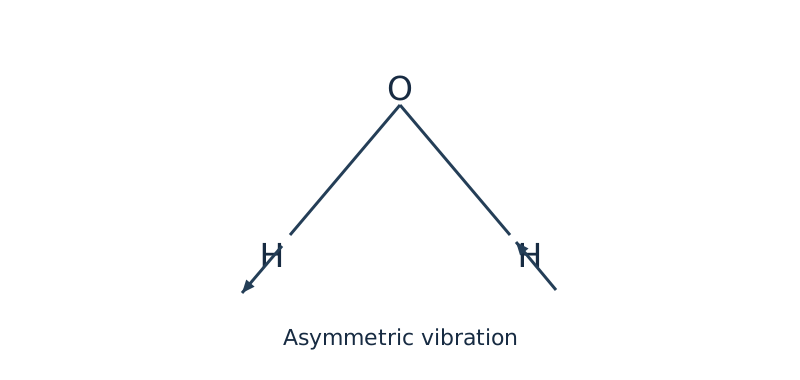
: change in dipole moment IR active
Page 17 of 58
3. In-plane bending vibration
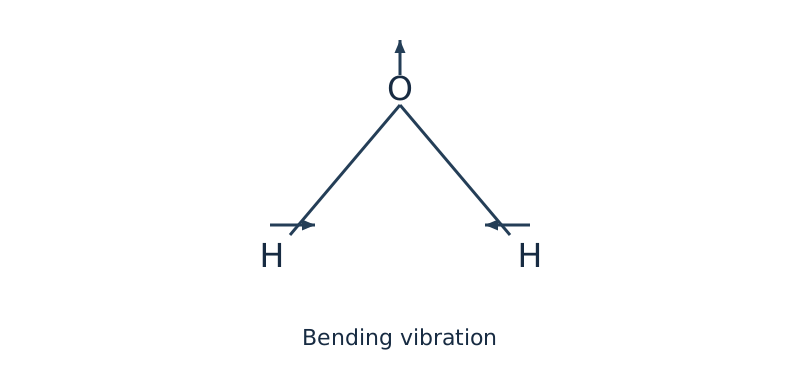
The dipole moment changes during this vibration, so it is IR active. The source notes show three IR signals for H₂O.
Calculation of force constant (K)
Vibrational frequency depends on bond length and atomic masses. The wavenumber is
where is the speed of light, is the force constant, and is the reduced mass:
Squaring and rearranging gives
Use consistent units for and ; with SI units, is in N m⁻¹.
Question: A CO molecule absorbs infrared radiation at 2140 cm⁻¹. Calculate its force constant, given atomic masses C = 12 amu and O = 16 amu. The solution continues on the next page.
Page 18 of 58
Page 19 of 58
APPLICATIONS OF IR SPECTROSCOPY:
-
Determination of force constant of a molecule.
-
Identification of functional groups in organic compounds.
Eg:
Functional Groups Stretching frequency 1. 2. 3. 4. in alkene 5. -
Determination of unknown compounds.
-
Determination of purity of a compound.
-
To distinguish inter-molecular and intra-molecular hydrogen bonding.
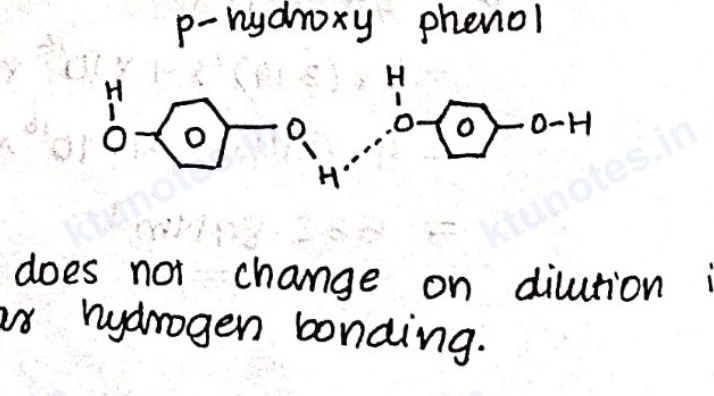
INTER-MOLECULAR HYDROGEN BONDING
o-hydroxy phenol
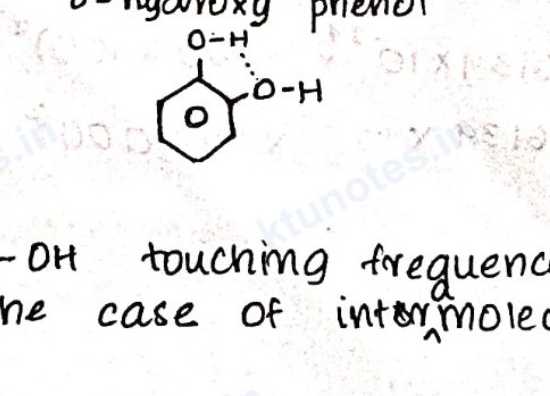
INTRAMOLECULAR HYDROGEN BONDING
p-hydroxy phenol
-
stretching frequency does not change on dilution in the case of intermolecular hydrogen bonding.
-
In -hydroxy phenol, there exist intramolecular hydrogen bonding. The molecule gets separated on dilution and intramolecular hydrogen bond weakens and there is shift of absorption frequency with dilution.
-
In -hydroxy phenol, bonding is intramolecular which is not affected by dilution.
Page 20 of 58
DIELECTRIC THERMAL ANALYSIS (DETA)
- DETA is used to study dielectric and thermal properties of samples.
- It can give information about dielectric changes with temperature.
- In this technique, the change in dielectric properties of a material under an applied voltage is recorded with change in temperature.
Principle of DETA:
-
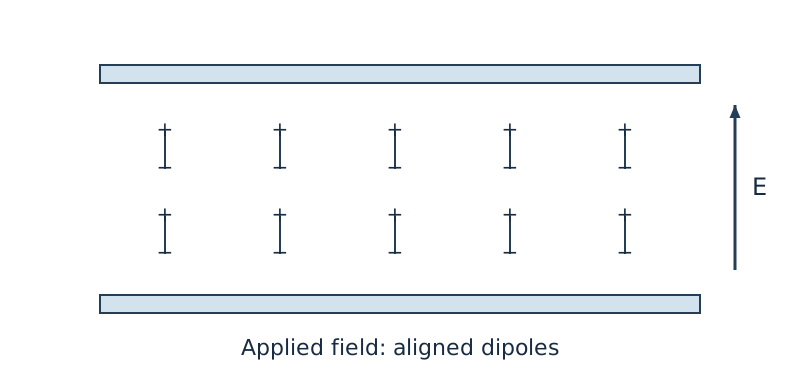
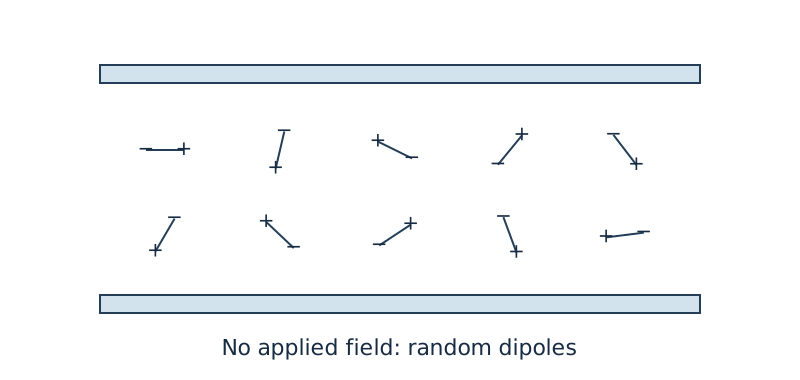
In DETA technique, the sample under study is subjected to an electric field.
-
The applied sinusoidal voltage (alternating current) will polarise the sample which forces the charge carriers inside the sample to move (positively charged particle migrate to negative pole and vice-versa).
-
This movement results in a sinusoidal current with phase shift which is being measured.
-
Here, the polarisation change of the material under varying temperature is measured at a fixed frequency.
-
PERMITTIVITY (): It is the ability of a material to store electrical energy under an applied electric field.
-
DIELECTRIC LOSS (): It is the energy dissipated as heat when a material is subjected to electric field.
-
DISSIPATION FACTOR () : It represents efficiency of a material to convert electrical energy to heat energy under an electric field.
Page 21 of 58
Material with lower value of is preferred as thermal insulator and capacitor applications.
INSTRUMENTATION OF DETA:
flowchart LR
FG["Frequency generator"] --> E["Electrodes and sample in programmable furnace"]
ENV["Environmental control"] --> E
TC["Temperature controller"] --> E
TS["Thermocouple / temperature sensor"] --> TC
E --> DA["Dielectric analyser"] --> REC["Recorder"]
-
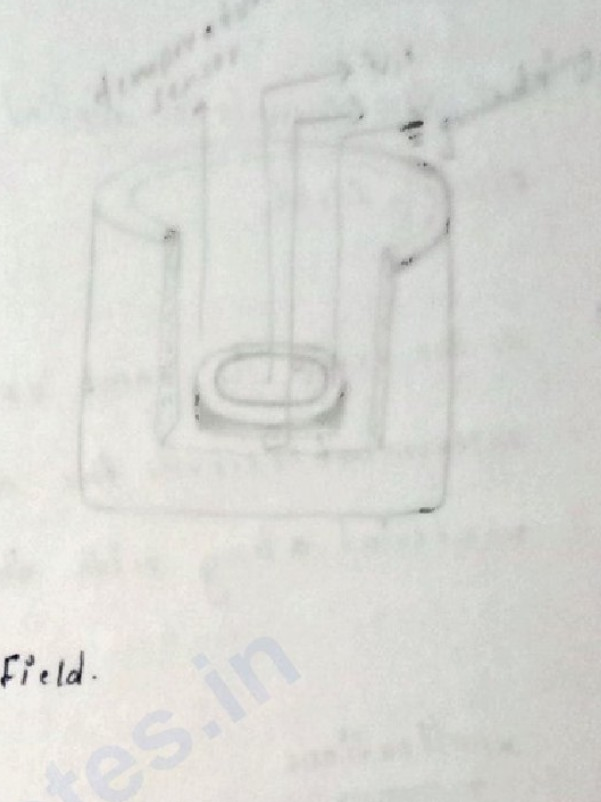
Sample Holder : sample is placed between two parallel metal plates (electrodes).
-
Temperature programmable furnace : Furnace with temperature programming facility is used to ramp up and down the temperature of the sample.
-
Frequency Generator : Sinusoidal voltage (ac) is provided through the frequency generator.
-
Temperature control unit / equipment : Prevents over heating of the sample.
-
Environmental control equipment : It is used to provide suitable atmosphere (air or inert gas) for the sample as per requirement.
Page 22 of 58
- Thermocouple / Temperature sensor: Used to measure temperature changes of sample.
- Dielectric Analyser: Key component of DETA instrumentation which acts as detector and detects permittivity and dielectric loss with change in temperature.
- Recorder: Computer will record the data and DETA curve is obtained as a plot between permittivity versus temperature or dielectric loss versus temperature.
WORKING:
- Sample in the form of thin film, powder, pellet, etc is placed between two electrodes and then electric field is applied.
- The temperature of the sample is increased at a controlled rate using temperature programmable furnace under suitable environmental condition.
- The response signal is detected and analysed using dielectric analyser.
- The dielectric response is recorded for every change in temperature under a constant frequency.
- Temperature of the sample is monitored by thermocouple.
- DETA plot is obtained between vs or vs .
APPLICATIONS:
- Used to study dielectric and thermal properties of material.
- It is used to analyse polymers, plastics, glasses, ceramic, etc.
- Used to identify phase transition temperature like glass transition temperature of polymers.
Page 23 of 58
used to study curing profile of thermosets. used to study epoxy curing process. Study of dielectric properties at different temperature is used for the development of new insulating material and energy storage material.
SCANNING ELECTRON MICROSCOPE (SEM)
SEM produce image of a sample by scanning the surface of the sample high energy electron beam. The interaction of electron beam with the atoms near the surface of the sample produce different signals - backscattered electrons, secondary electrons and X-ray. These signals are detected by suitable detectors and can be used to obtain information about surface topography (size, shape and texture) and elemental composition
SECONDARY ELECTRONS: These are directly knocked out from the atom of the sample by incidental electron.
BACK SCATTERED ELECTRON: These are incidental electrons that are reflected backwards.
X-RAYS: Emitted from the sample
Page 24 of 58
INSTRUMENTATION
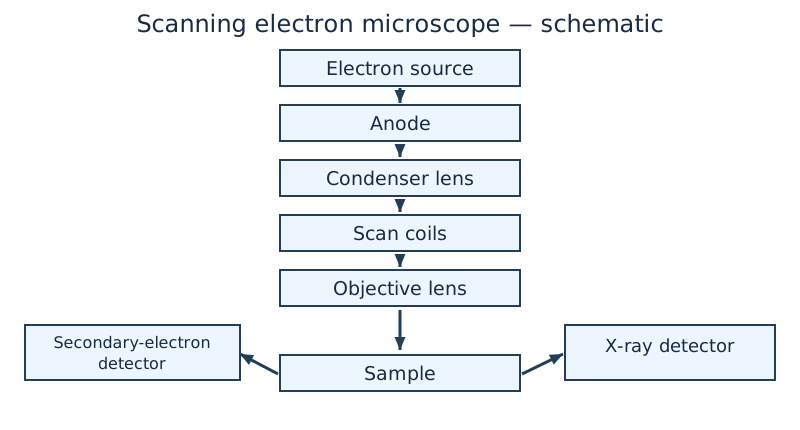
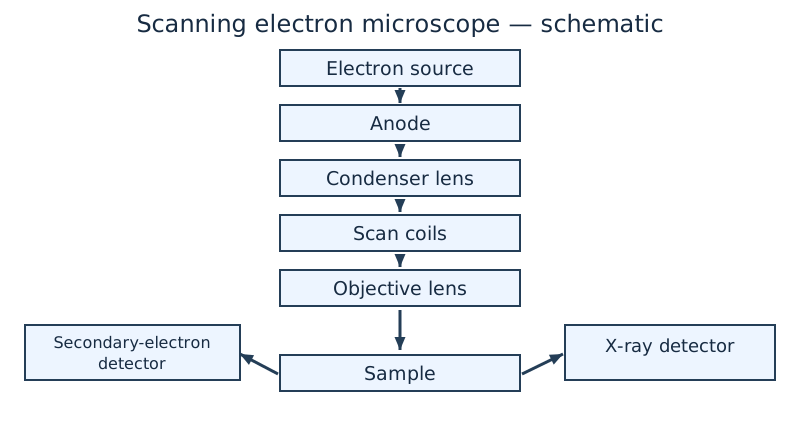
- source : electron source generates high energy electron beam. Thermionic gun or field emission guns are used as electron source.
- Anode : Positively charged anodes are used. It can accelerate the electron beam.
- condenser lens : It is a electromagnetic lens. can be used to focus the electron beam into small, thin and coherent beam.
- scan coil : Deflects the electron beam horizontally and vertically over the surface of the sample and scan the surface in rectangular fashion.
- Objective lens : It is also an electromagnetic lens used to focus electron beam to the surface of the sample.
- Detectors : There are suitable detectors to detect secondary electrons and x-rays.
- sample : should be conductive and dehydrated.
Page 25 of 58
WORKING:
↳ Electron gun generates high energy electron beam which are accelerated by anode.
↳ Accelerated electron beam is focused by condenser lens.
↳ Objective lens focus the beam onto sample where the solid sample is placed.
↳ Scan coil scan the surface in raster fashion.
↳ Secondary electrons and x-rays are produced from the sample and detected by suitable detectors.
↳ Black and white three dimensional image of the sample is obtained after processing.
APPLICATIONS:
↳ Used to characterise nanomaterials.
↳ Used to detect and analyse surface fracture and contamination.
↳ Used as an essential research tool in fields like lifescience, nanoscience, medical and forensic science.
Page 26 of 58
[Non-content page]
Page 27 of 58
module - 3
Spectroscopy and analytical technique
Advantages of spectroscopy technique
- less sample quantities required.
- sample material remain unchanged during analysis and resuse.
- requires very less time.
- They give acurate result.
- spectroscopy deals with the interaction of atoms or molecules or matter with the electromagnetic radiation.
flowchart LR
I["Interacting radiation"] --> S["Atom / molecule (sample)"] --> T["Transmitted radiation"] --> D["Detector"]
Electromagnetic spectrum
- electromagnetic radiation arranged by wavelength or frequency
- It includes radiowaves, microwaves, IR, VL, UV, X-Ray and gamma ray.
- wavelength decreases and frequency increases from radio waves to gamma rays
- Energy of radiation increases from low-frequency to high frequency.
Page 28 of 58
Different energy levels in a molecule.
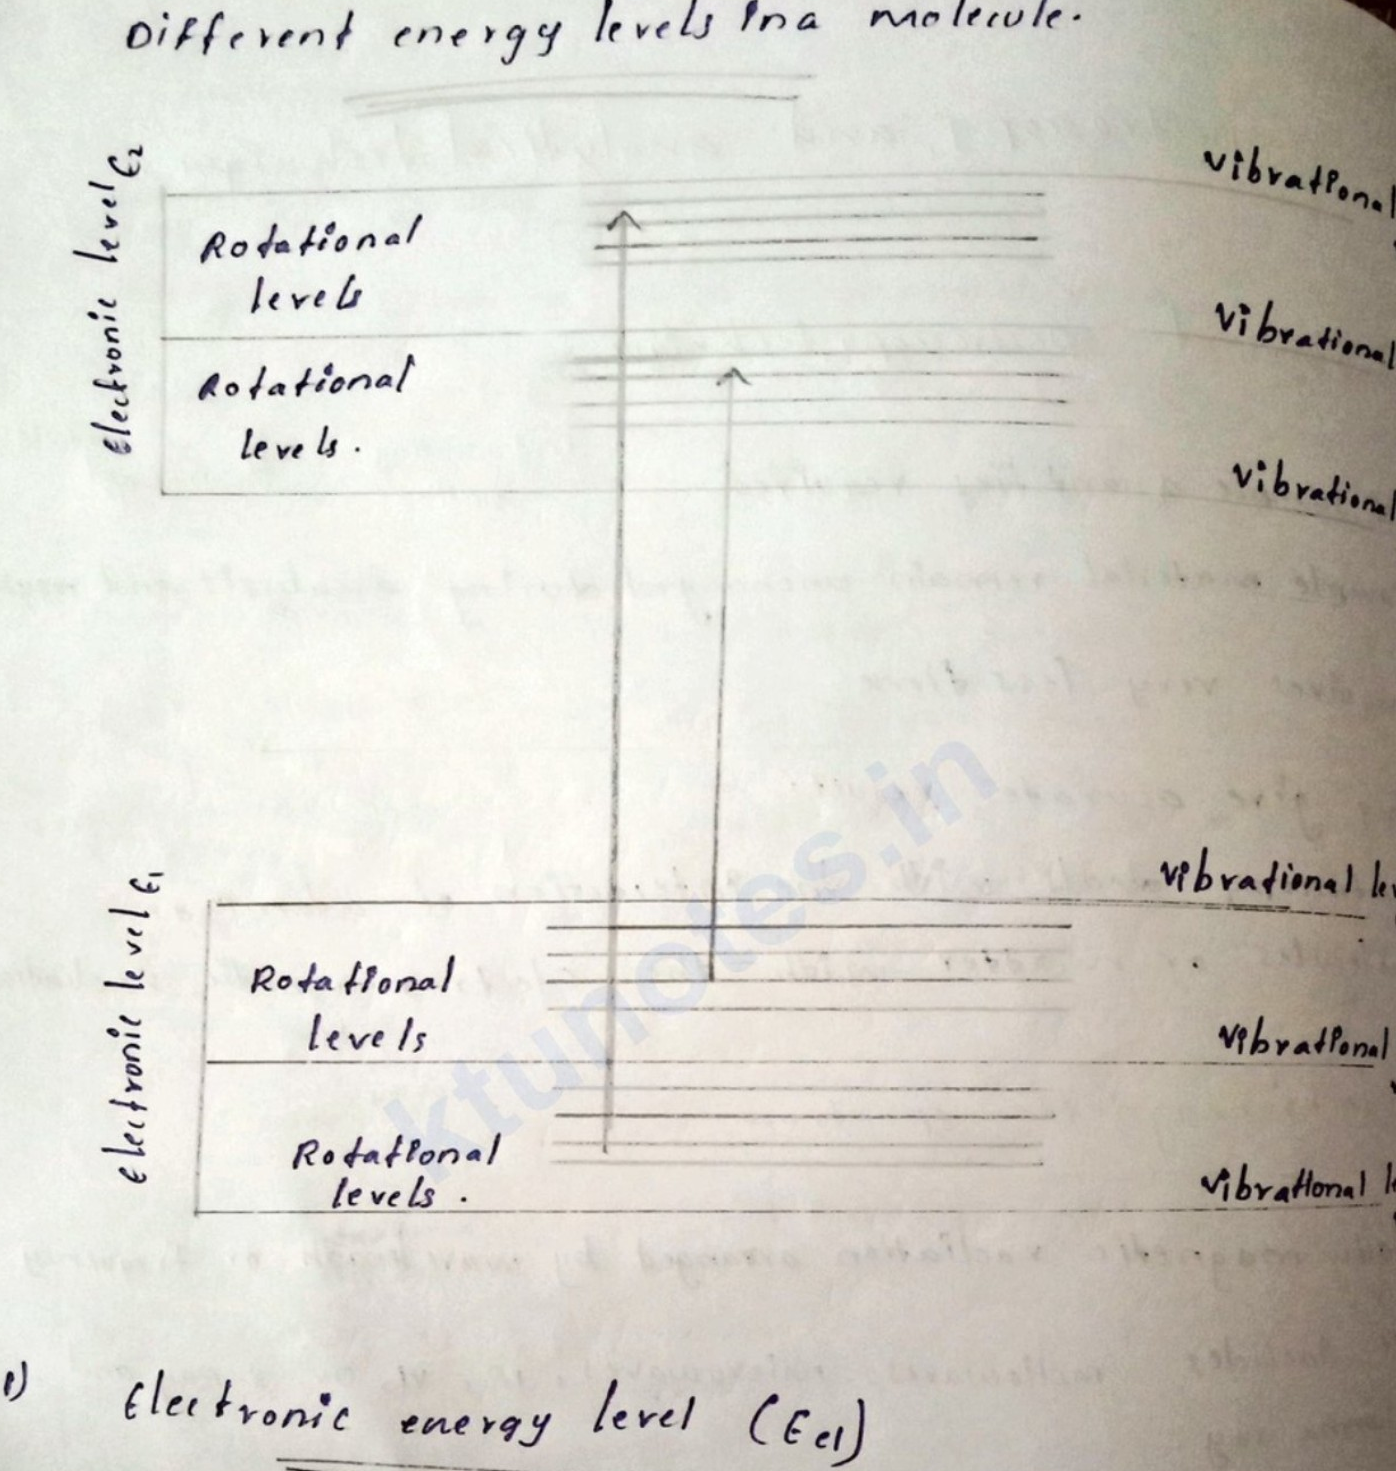
- Electronic energy level ()
Energy levels associated with the electrons present in the molecules
These energy levels falls in uv visible region
The spectrum associated with electronic energy level [uncertain: ...]
Page 29 of 58
is called uv visible spectroscopy.
- vibrational energy level ()
=> The energy level associated with vibration is called vibrational energy.
=> Atoms in a molecule can vibrate by keeping the position of center of mass constant.
=> The energy gap betw falls in infrared region.
- Rotational energy levels ()
=> The energy level associated with rotation is called rotational energy level.
=> If a molecule rotate in space about an axis passing through its centre of mass.
=> The energy gaps between rotational energy level falls in microwave region.
- Translational Energy Level ()
=> The energy level associated with translational energy is called translational energy level.
=> If the position of centre of mass changes with time the molecule is said to possess the translational energy.
=> Translational energy of a molecule is usually not quantised.
can be neglected.
Page 30 of 58
Types of spectrum
- Based on the nature of interaction.
| Emmision spectrum | Absorption spectrum |
|---|---|
|
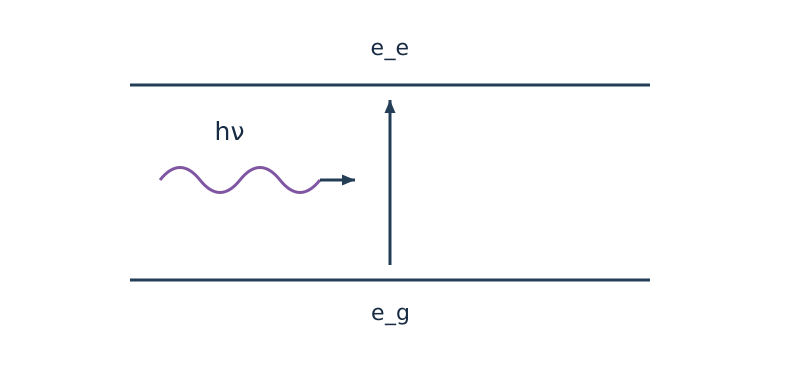
| | when an atom or molecule undergoes transition from higher energy level to lower energy level with a absorption of photon [uncertain: emission] of energy is emmision spectrum. | when an atom or molecule undergoes transition from lower energy level to higher energy with an absorption of a photon is called absorption spectrum. | | Hydrogen spectrum, atomic emmision spectrum, fluorescence spectrum etc... belongs to it. | It includes uv-visible, IR, Microwave and NMR. |
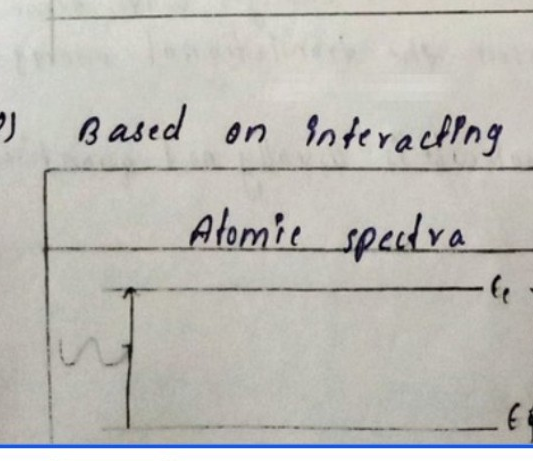
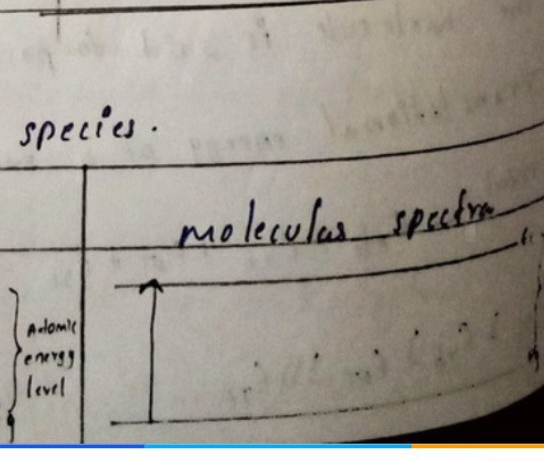
- Based on interacting species.
| Atomic spectra | molecular spectra |
|---|---|
|
|
Page 31 of 58
which arise from the transition of electrons between atomic energy levels.
which arise from the transition of electrons between different molecule energy levels.
UV visible, IR, microwave, NMR belongs in it.
IMP Beer-lamberts law.
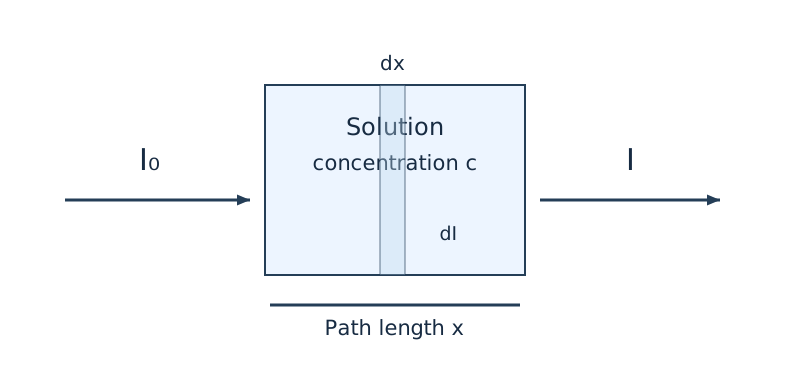
\log \frac{I_0}{I} &= \varepsilon c x = A \\ A &= -\log \frac{I}{I_0} \\ &= -\log T \\ &= \log \frac{1}{T} \end{aligned}$ $\boxed{\log \frac{I_0}{I} = \varepsilon c x}$ $\boxed{\log \frac{1}{T}}$ ---
Page 32 of 58
=> When a parallel beam of monochromatic electromagnetic radiation is pass through an absorbing medium of given conc. , the rate of decrease is intensity, of radiation, with thickness of the solution is proportional to the intensity of incident radiation at that point and also the concentration of the solution.
Absorbance
=> It is the logarithmic ratio of intensity of incident radiation to the transmitted radiation.
Transmittance
=> It is the ratio of transmitted radiation to the incident radiation.
intensity of incident radiation.
transmitted radiation.
molar absorption .
conc. in .
Thickness in decimeter.
Absorbance.
Transmittance.
Page 33 of 58
What is molar absorbtion coefficient () write it's unit.
How can you determine the unknown concentration using Beer Lamberts law (by graphical method).
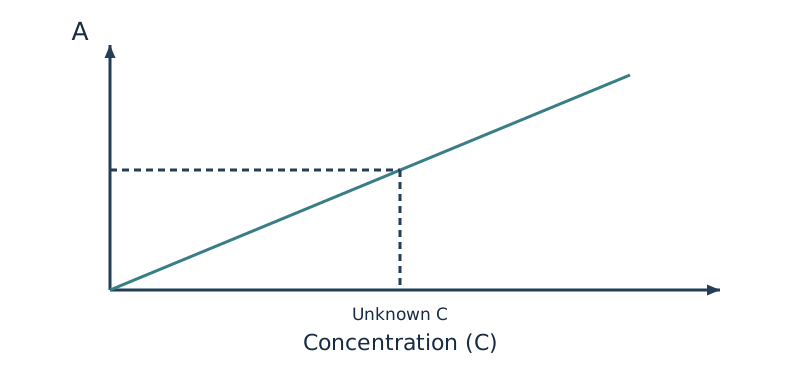
graph derived from unknown concentration.
Based on the graph derived from know concentration and absorbance, we can find out the unknown concentration using it's unk- absorbance value.
The percentage transmittens of dye solution in ethanol is . In a cell for a light of wavelength .
Find the absorbance and molar absoption constant.
Page 34 of 58
-
A dye solution of concentration shows absorbance of at while a test solution of same dye shows absorbance of under same conditions. Find the concentration of test solutions.
.
Page 35 of 58
A standard solution of after developing red colour with ammonium thiocyanate shows a transmittance of at , while an unknown solution of after developing colour with same amount ammonium thiocyanate gives transmittance of . Find the conc. of solution?
.
Page 36 of 58
UV-visible spectroscopy IMP
- - Far UV / vacuum UV.
- - neer UV
- - visible region
Principle:
- If a material blue in colour it absorb the orange red visible line.
- When a molecule interacts with UV-visible radiation, electronic transition will occur between electronic energy levels by absorbing the radiation.
- It is also called electronic spectrum - transition occurs between electronic energy level.
- It is a plot of absorbance or intensity vls in .
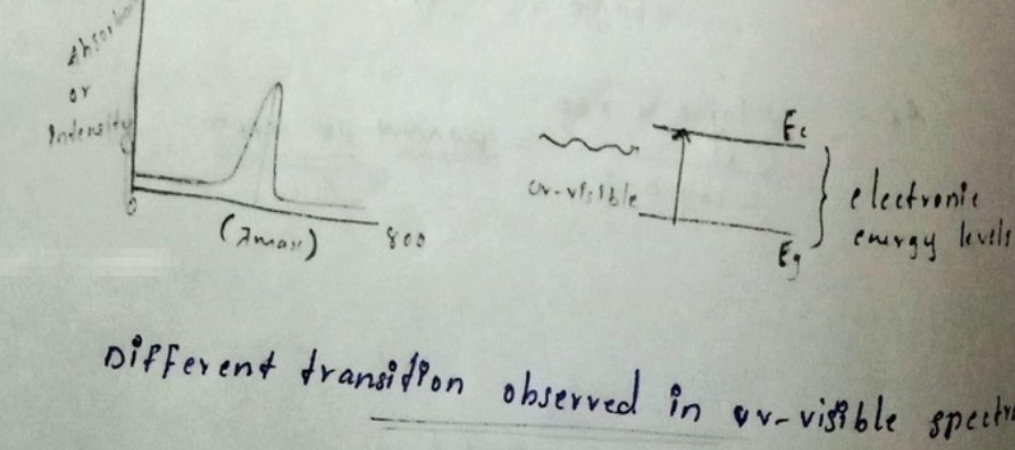
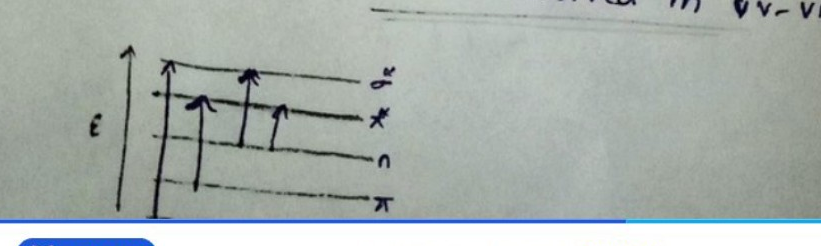
Different transition observed in UV-visible spectroscopy
Page 37 of 58
In a molecule there are three types of electrons
- electrons - bonding
- electrons - bonding
- " - lone pairs - non bonding
It is mainly observed in molecule with sigma bonds. Hydrocarbons can shows this prop signal. It mainly occur at uv region, below
mainly it is observed by molecules containing double bond or tripple bond.
it can be used for determine the organic functional grp.
The value depends upon the conjugation of the molecule.
.
mainly observed by molecules with lone pairs of electron and multiple bond
It can be used for determinem the functional groop
Page 38 of 58
mainly observed by molecule with electrons and sigma bond. It contains hetero atoms. such as, oxygen, [uncertain: ni...]
e.g: , Alcohol, ether
Effect of conjugation in UV-visible spectroscopy
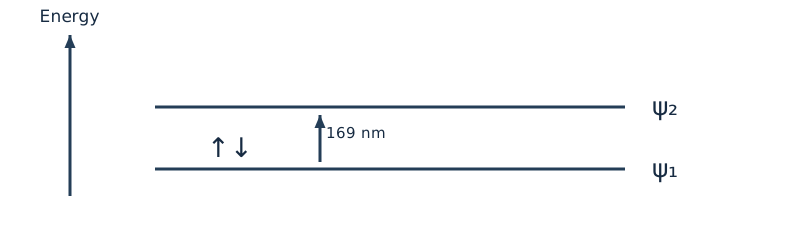
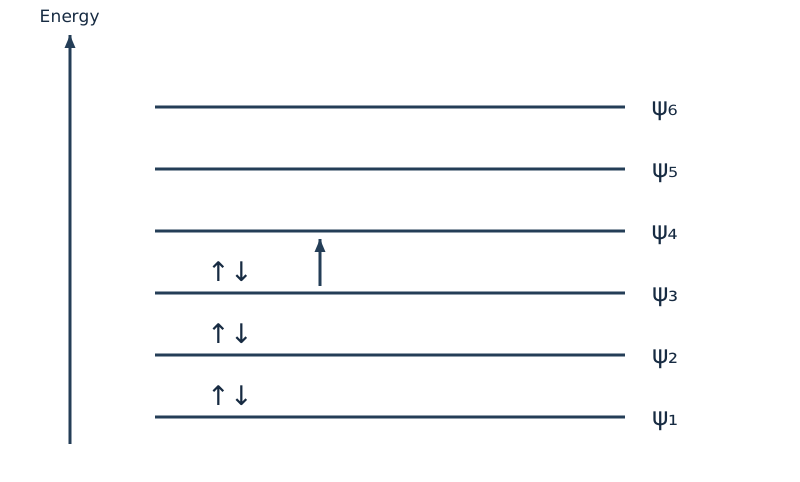
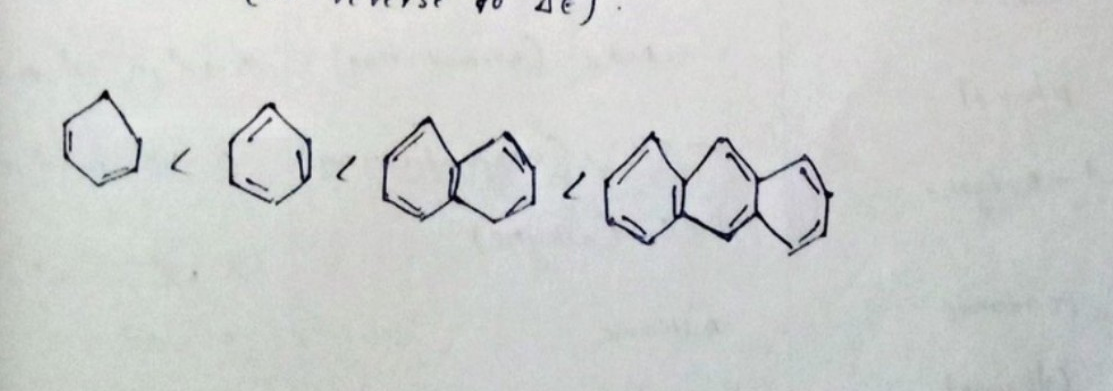
On increasing the conjugation, stability of the molecule increases. So decreases and increases.
-
ethene ()
-
Buta-1,3-diene - ()
-
hex-1,3,5-triene - ().
-
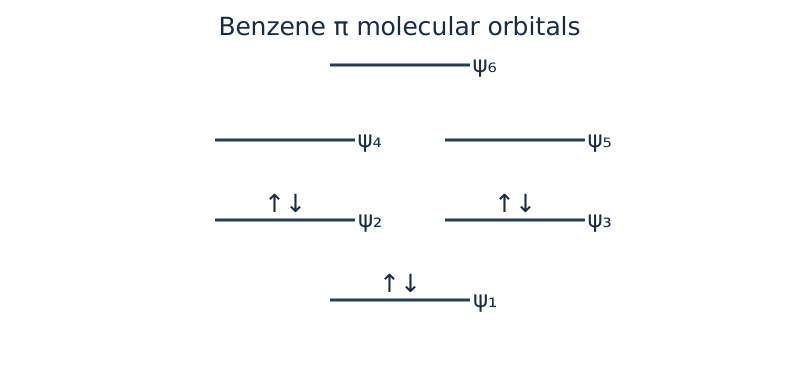
benzene - - ().
-
ethene
Page 39 of 58
- buta-1, 3-diene
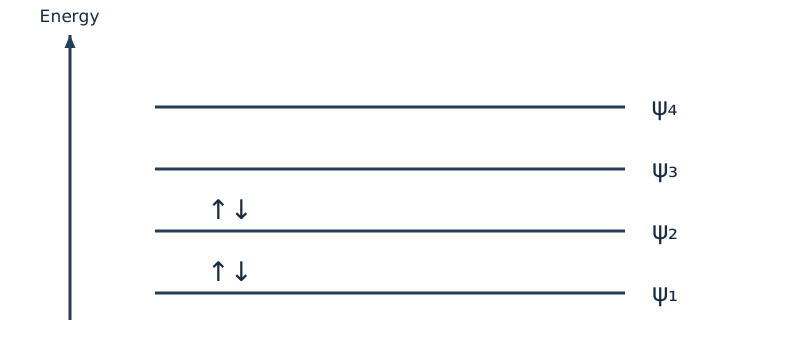
- hexa-1, 3, 5-triene.
- benzene.
- Arrange the increasing order of uv-visible absorption or (or reverse to ).
Page 40 of 58
- List out the allowed transition observed in the following molecule ?
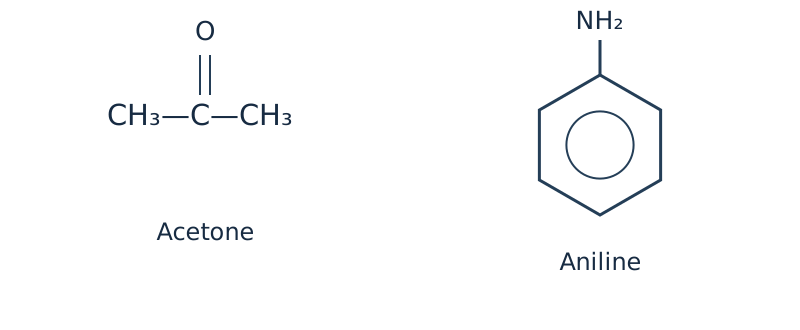
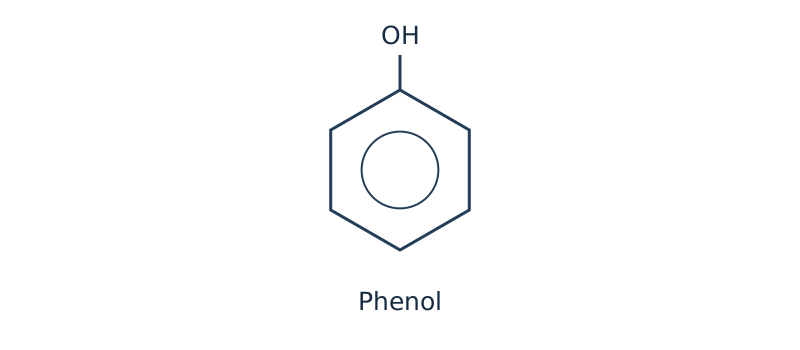
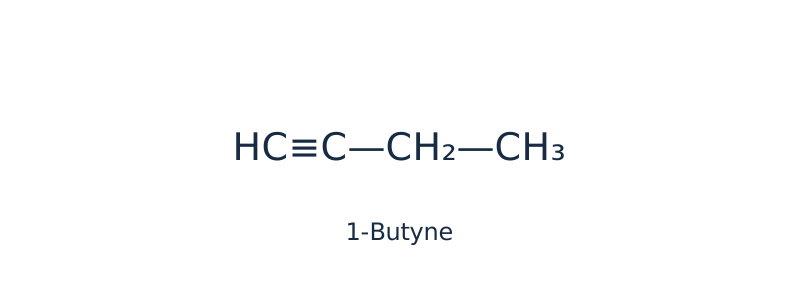
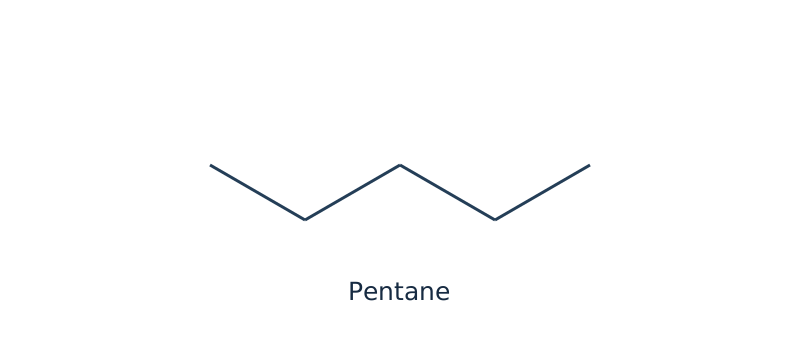
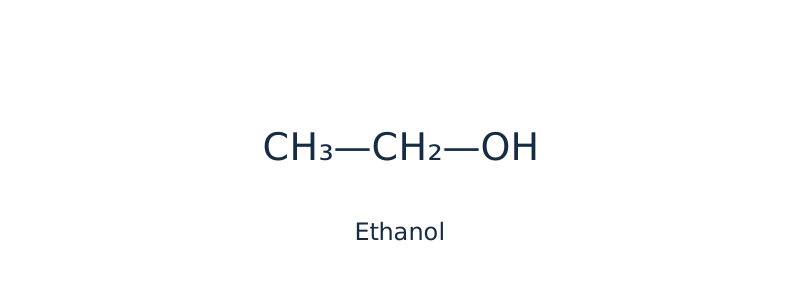
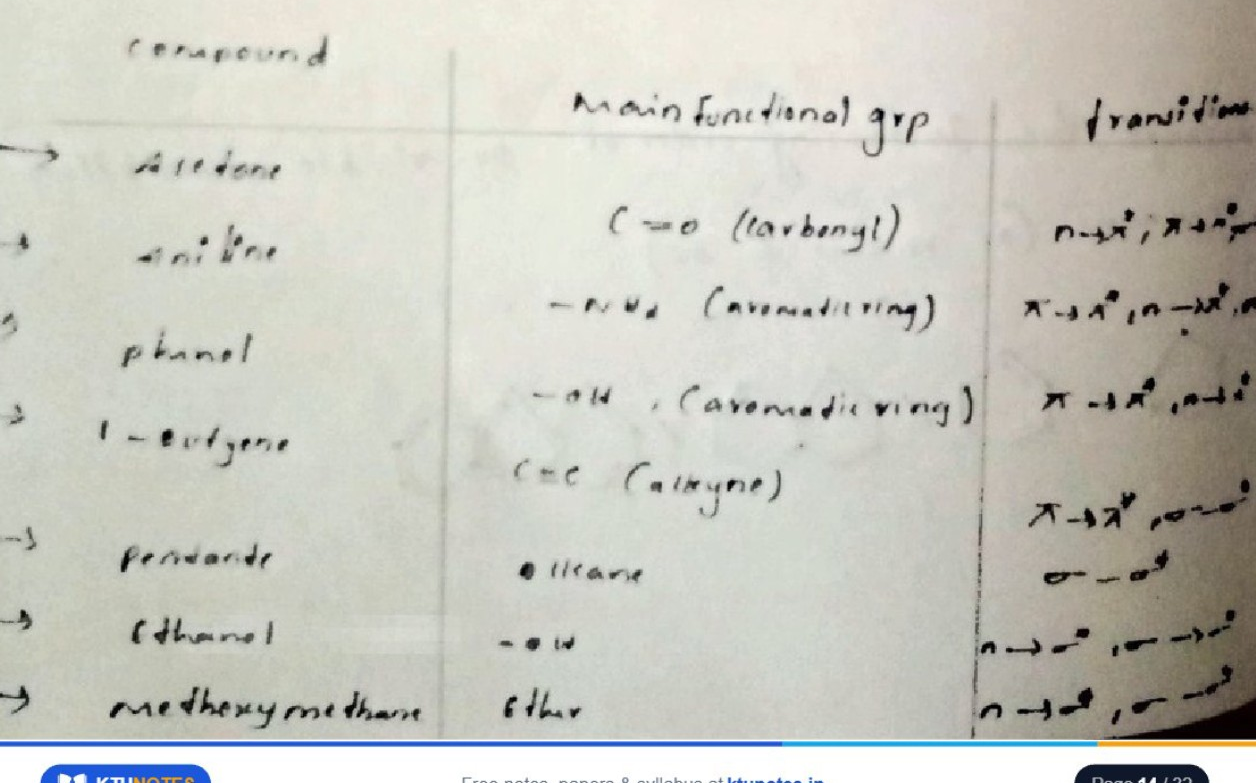
| compound | Main functional grp | transition |
|---|---|---|
| Acetone | (carbonyl) | , [uncertain: ...] |
| aniline | (aromatic ring) | , , [uncertain: ...] |
| phenol | (aromatic ring) | , , [uncertain: ...] |
| 1-butyne | (alkyne) | , |
| pentane | alkane | |
| ethanol | , | |
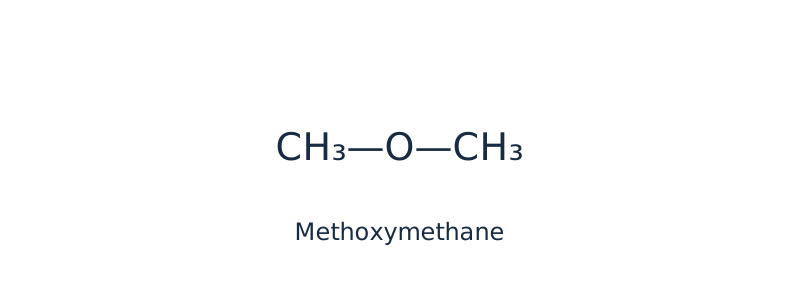
| methoxymethane | Ether | , |
Page 41 of 58
Instrumentation of UV-visible spectroscopy
block diagram
flowchart LR
S["Radiation source"] --> M["Monochromator"] --> B["Beam divider"]
B --> R["Blank / reference cell"] --> DR["Reference detector"]
B --> C["Sample cell"] --> DC["Sample detector"]
DR --> A["Amplifier"]
DC --> A
A --> REC["Recorder"] --> O["Absorbance vs wavelength"]
Components In UV-visible spectroscopy
- Radiation source. Tungsten filament lamp. or -discharge lamp. or xenon flash lamp.
- Monochromator.
- Beam divider.
- Cuvette For reference and sample.
- Blank detector, sample detector.
- Amplifier.
- Recorder.
Page 42 of 58
monochromator prism or grating
beam divider split in to two, one through reference & other through sample
cuvette container sample molecule dissolved in suitable solvent. reference solvent only
blank detector Generally electronic detectors are used. sample detector
A beam of light split in to two equal beams one is pass through sample () and other through reference (). Then the intensity of these light beam are measured after passing through sample and reference by using electronic detectors and compared.
If light does not absorbed by sample
If light absorbed by sample and it's recorded in the plot of absorbance v/s wavelength in nm.
Page 43 of 58
Applications of uv-visible spectroscopy
- [illegible] different transitions absorbed
- Identifications of materials.
- To study about the molecules and materials by using its max value.
- Identification of functional groups using & transitions.
- To study about coloured materials and dyes
- To identifies the impurities present in a material by comparing the uv-visible absorption.
- To study about the kinetics of a reaction.
- To find out the unknown concentration by graphical representation.
IR-spectroscopy / vibrational spectroscopy
- It is a plot of percentage transmittence v/s wave numbers ()
- The range
Page 44 of 58
-> Principle
When a molecule interact with IR radiation vibrational transition will occur between vibrational energy level by absorbing IR-Radiation. It is also called vibration spectrum, since transition occur between vibrational energy level.
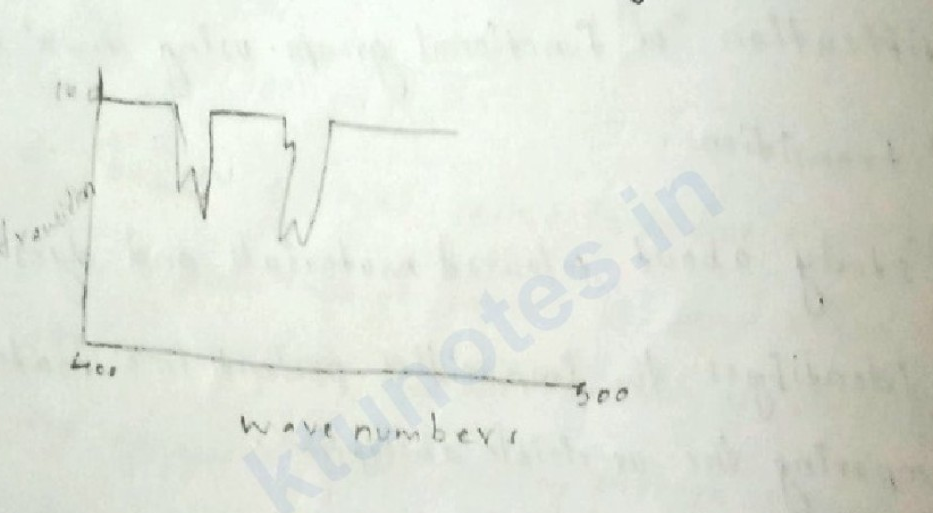
-> The photons of IR radiations are not energetic enough to cause electronic transition.
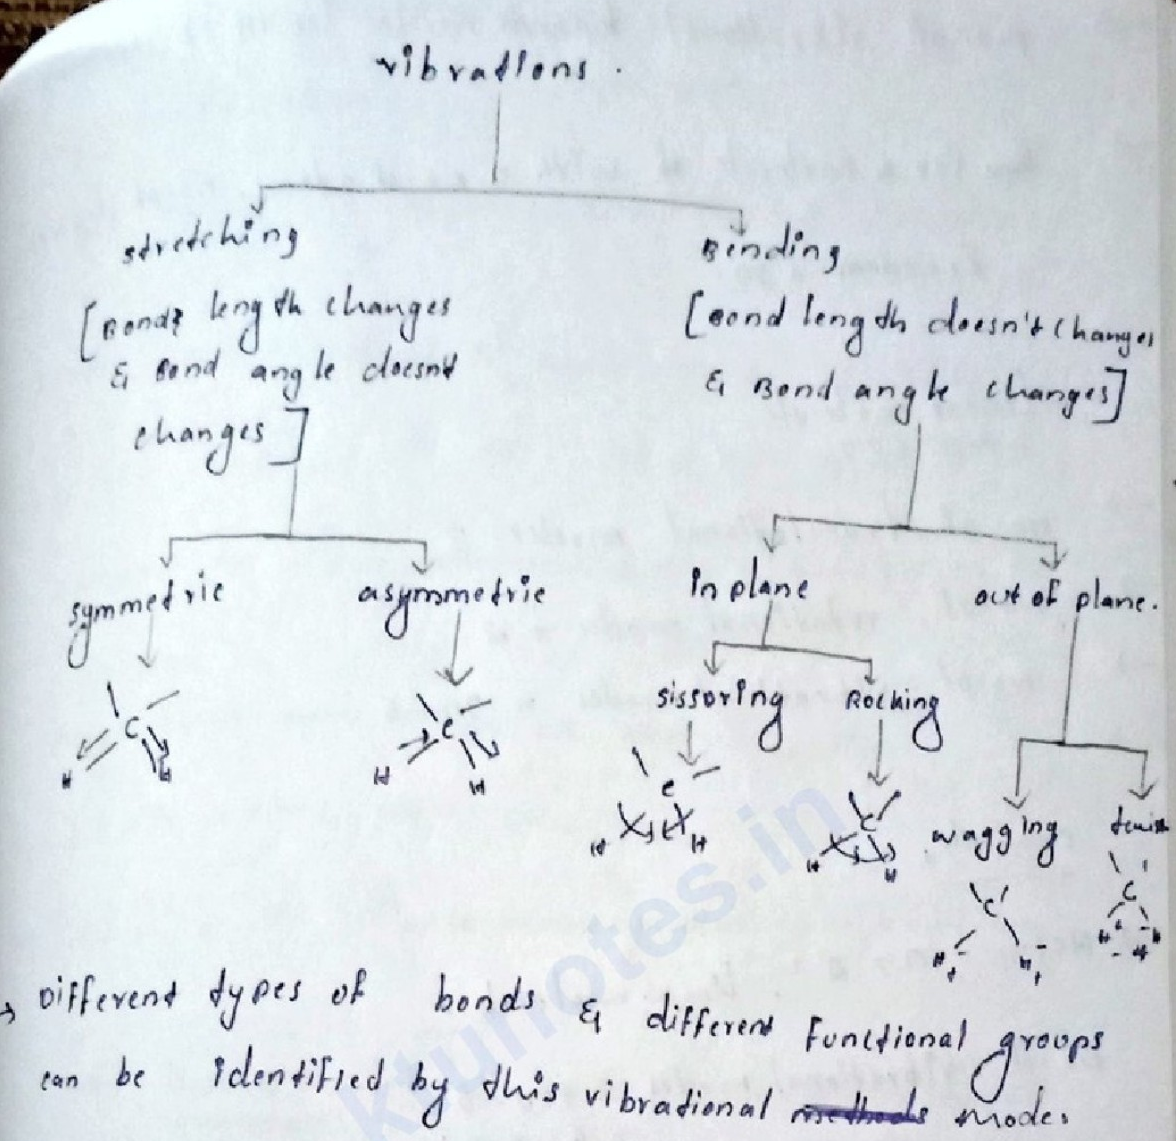
-> By absorbing IR radiation by a molecule, vibrations will occur (either stretching or bending).
Page 45 of 58
vibrations.
-
Different types of bonds & different functional groups can be identified by this vibrational methods modes.
-
The absorption is followed,
Force constant (strength of a bond).
reduced mass.
Here, m₁ and m₂ are the masses of the connected atoms.
Page 46 of 58
no. of vibrational bands modes in IR spectroscopy.
Then for a molecule of with 'n' no. of atoms, no. of degrees of freedom = .
Linear molecule
no. of translational modes =
no. of rotational modes =
no. of vibrational modes =
Example,
HCl, , linear molecule.
no. of vibrational modes = .
HCl have only symmetric strething
Dipole moment will be change so IR active.
.
no. of vibrational modes = .
symmetric streching.
no change in dipole moment. IR inactive.
Page 47 of 58
Homonuclear diatomic molecules are IR inactive.
eg: .
No change in dipole moment during vibration.
Heteronuclear diatomic molecules are IR active.
eg:
Change in dipole moment during vibration.
polynuclear molecules - all are IR active
eg:
Change in dipole moment during vibration.
Non-linear molecules - No. of vibrational modes
No. of translational modes = 3.
No. of vibrational modes = .
No. of rotational modes = 3.
eg:
- non-linear.
No. of vibrational modes.
.
Page 48 of 58
Vibrational modes of CO₂
CO₂ is a linear molecule with n = 3 atoms, so it has
vibrational modes.
1. Symmetric stretching
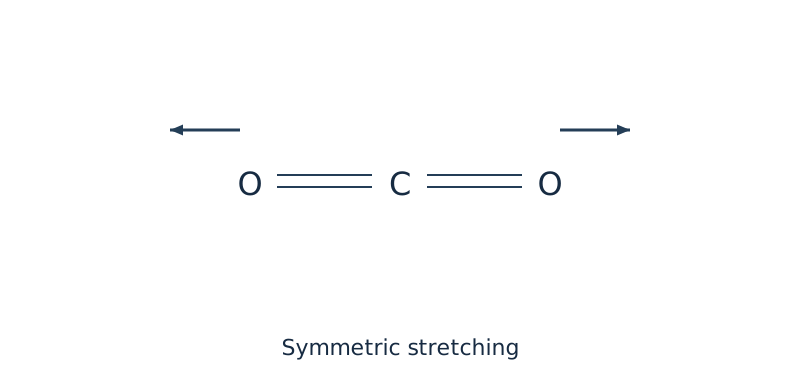
The dipole moment does not change during this vibration. Symmetric stretching is IR inactive.
2. Asymmetric stretching
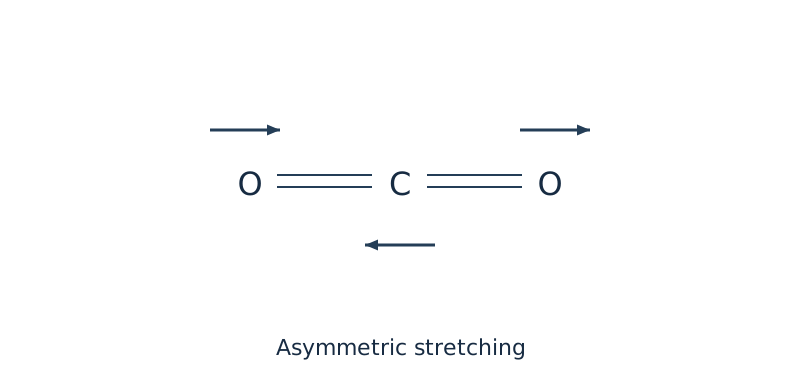
The dipole moment changes during this vibration, so asymmetric stretching is IR active.
3. In-plane bending
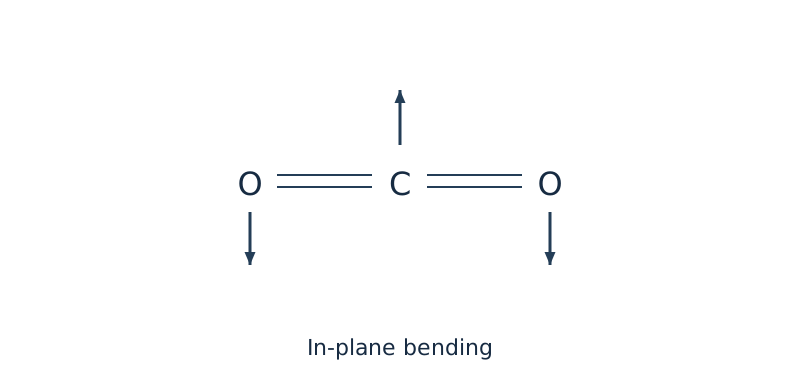
This vibration changes the dipole moment and is IR active. The second bending mode continues on the next page.
Page 49 of 58
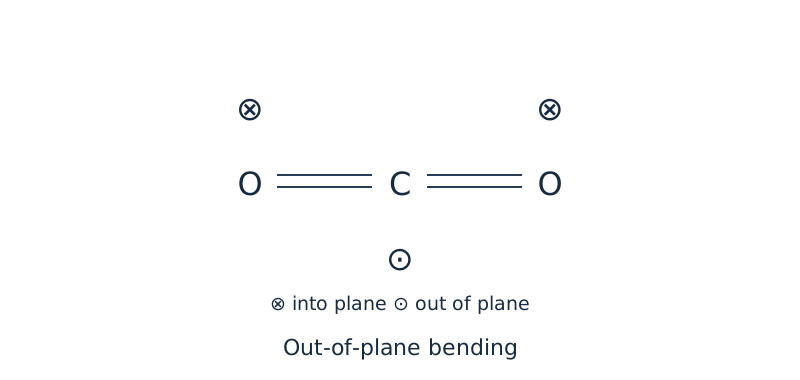
- out of plane bending.
- IR absorption at
- change in dipole moment.
- IR inactive.
conclusion
- for 4 vibrational modes - 3 are active but only 2 signals.
- non linear molecules.
No. of vibrational mode
.
(1)
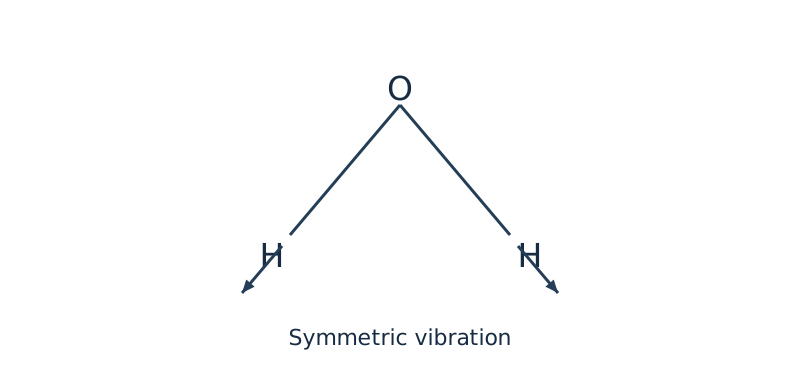
- change in dipole moment.
- symmetric stretching.
- IR active.
Page 50 of 58
(2).
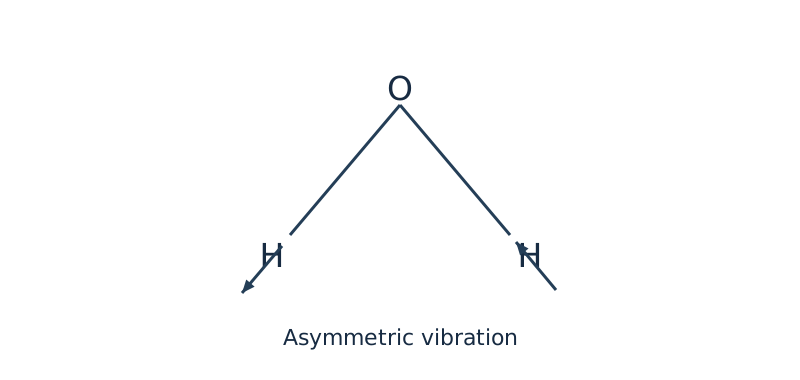
assymetric stretching.
IR active.
change in dipole moment.
(3).
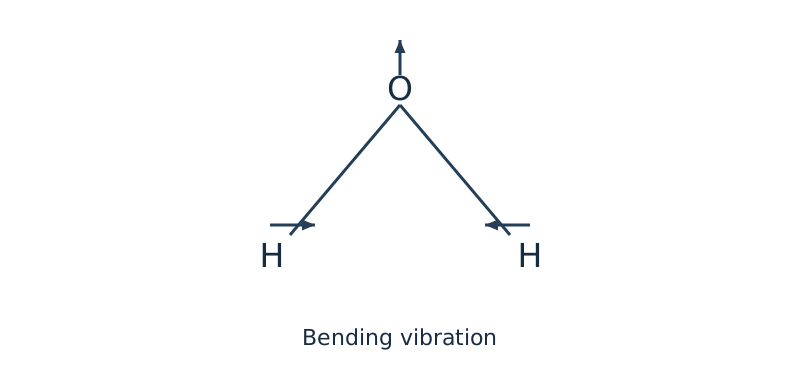
IR active.
Bending vibration.
change in dipole moment.
- Predict the following based on IR activity and give reason?
- poly nuclear molecule.
IR active.
- cyclohexane () poly nuclear molecule
IR active.
change in dipole moment.
- IR inactive.
no change in [illegible]
Page 51 of 58
[illegible] poly nuclear. IR active.
- How can you distinguish & .
- , by using IR spectroscopy.
\mu - \text{same}\\ k - \text{diff} \end{matrix}\right\} \text{IR absorption will be different.}$ 2) $C-C$, $C=C$ $\bar{\nu} = \frac{1}{2\pi c} \sqrt{\frac{k}{\mu}}$ $\left.\begin{matrix} k - \text{same}\\ \mu - \text{diff} \end{matrix}\right\} \text{IR absorption will be different.}$ <u>Applications</u> * To study about molecules, materials by using IR absorption value $(\text{cm}^{-1})$ * Identification of Functional grps. $\begin{aligned} OH & \simeq 3400 \text{ cm}^{-1} - 3600 \text{ cm}^{-1} \\ C=O & \simeq 1700 \text{ cm}^{-1} - 1800 \text{ cm}^{-1} \end{aligned}$ ---
Page 52 of 58
To identify the impurities present in a sample by comparing the IR absorption value of pure component.
To study about the kinetics of chemical reaction.
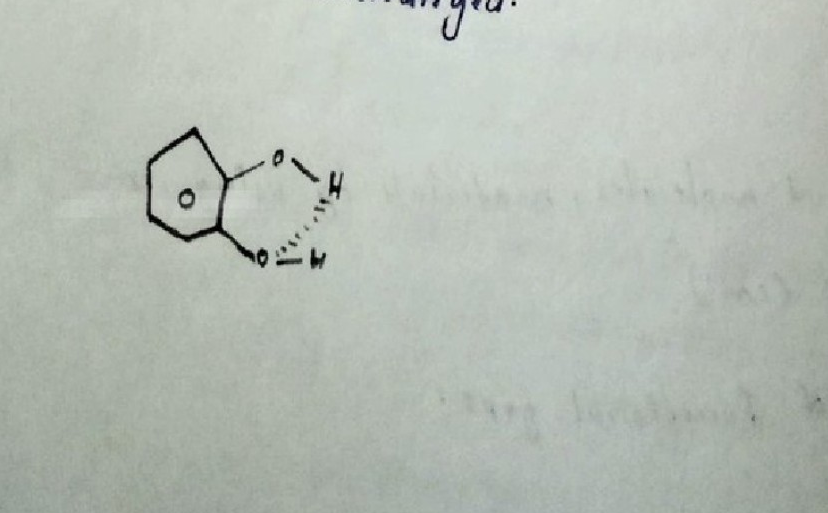
To study about intra & inter molecular hydrogen bonding.
ortho hydroxy phenol Intra molecular hydrogen bonding on dilution no change in the strength of O-H bond and hydrogen bonding because IR absorption remain unchanged.
Page 53 of 58
Para hydroxy phenol
- intermolecular hydrogen bonding.
- on dilution changes in strength of OH bond and IR absorption.
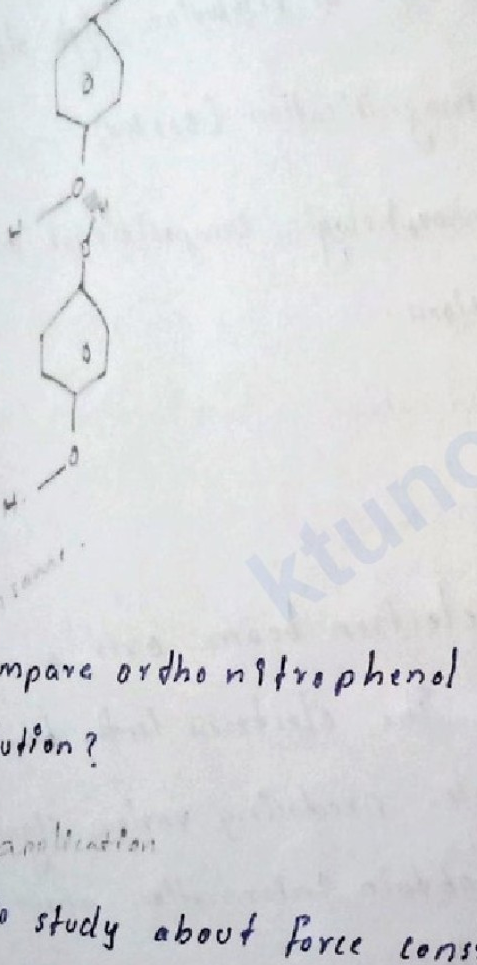
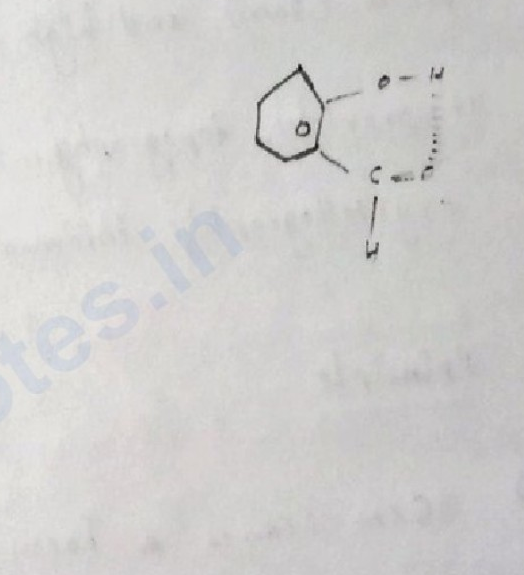
- Compare ortho nitrophenol & para nitrophenol with solution?
application => To study about force constant or the strength of the bond
Page 54 of 58
SEM (Scanning electron microscopy) IMP
-> It's a powerful magnification tool that utilises focused beam of electrons to obtain informations. -> It has high resolving power or resolution (1nm), high depth of field (30μm) and high magnification (300kx). -> It provides topography, morphologic, compositional and crystallographic informations.
Principle
-> SEM scanes a Focus electron beam over a suin to create an image. The electrons in the beam interact with the sample, producing various signals that can be used to obtain information about the surface of the material. -> There mainly two types of electrons are genner
Page 55 of 58
secondary electron
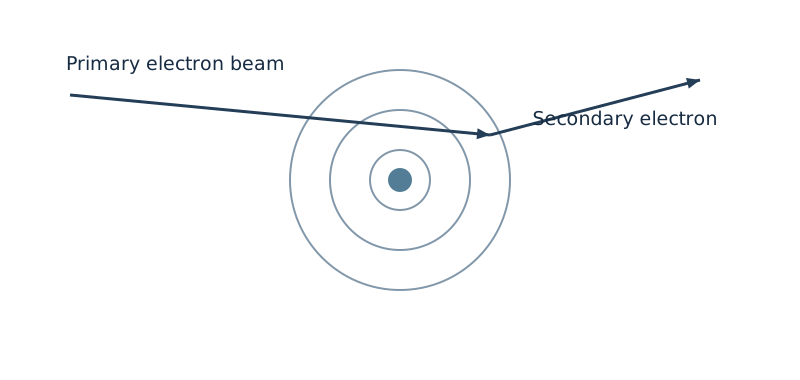
SE is generated by a inelastic interactions.
Widely used for imaging the sample.
Good topographic inform^n with good resolution.
BSE (Back scattered electron)
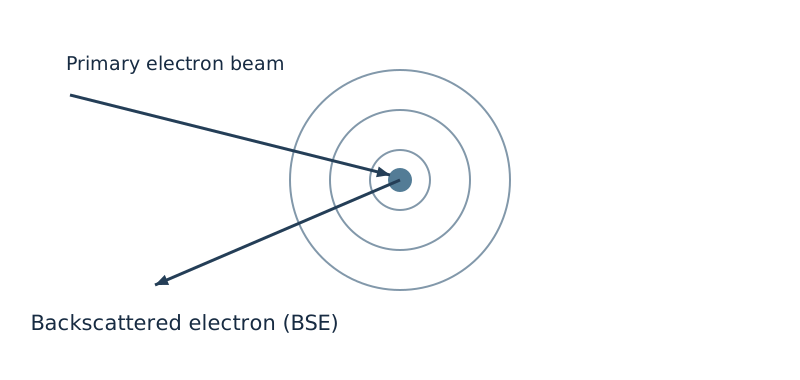
BSE is generated by a inelastic interactions.
It can also be used for imaging.
mainly it is generated by heavier elements.
It gives the information of composition and topography of the sample.
Instrumentation
Components.
-
Electron source.
-
Electro magnetic and/or electrostatic lenses [struckout: vacuum] chamber.
-
computer.
-
SE detector
-
BSE detector.
-
vacuum champer.
Page 56 of 58
Electron source.
Anode.
Condenser lens.
Scan coils.
Objective lens.
Secondary electron detector.
Sample.
Applications
- SEM helps in the characterisation of solid materials.
- It can detect and analyse surface structures, surface contamination, and provide information in microstructures.
- It helps to reveal spacial variation in chemical compositions and to identify crystalline structures.
- It used as an essential research tool in fields such as life science, nanoscience, medical, gemology and forensic science.
Page 57 of 58
Dielectric Thermal Analysis (DETA) IMP.
- It is also known as dielectric analysis (DEA).
- The technique used to study dielectric property of materials as they undergo changes in temperature.
- It is mainly used to study about dielectric behaviours of polymers, resins, and adhesives.
- mainly for polar or semipolar [uncertain: properties].
Principle
- When applying an electric field to a sample placed between two electrodes and monitoring how samples dielectric properties change with temperature.
- The mobile charge carrier (ions/dipoles) within the sample align with the electric field, resulting in a [illegible] which can be measured.
- These responses are directly proportional to sample [uncertain: related] permittivity parameters.
Page 58 of 58
Instrumentation.
Components of DEA:
- Dielectric analyzer
- Furnace
- Sample holder
- Frequency generator
- Data acquisition system
without external electrical field.
with external electrical field.