
Modern Electronics: Communication, Instrumentation, and Applications
This module introduces communication-system blocks, analog modulation, wired and wireless channels, fiber-optic links, mobile-network generations, electronic instruments, and selected Internet of Things (IoT) applications. The communication topics are qualitative; modulation derivations are not required.
Basic communication system
A communication system carries information from a source to a destination. A typical chain is:
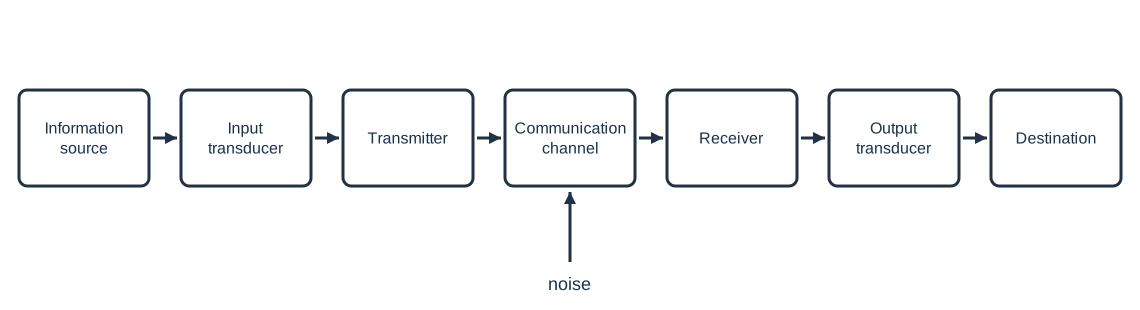
The transmitter prepares the signal for the channel; the receiver selects and recovers the message. A channel may be a wire, free space, or an optical fiber. Noise is an unwanted disturbance added during transmission.
For an exam block-diagram answer, explain the chain in signal order: the information source creates the message; an input transducer converts a sound, image, or other physical message into an electrical signal; the transmitter encodes or modulates it and raises it to a suitable level; the channel carries it; the receiver selects, amplifies, and demodulates it; and the output transducer converts the recovered signal into a form the destination can use. Noise enters through the channel and may be reduced by filtering or other receiver processing.
Amplitude and frequency modulation
A high-frequency carrier is varied to carry a lower-frequency message.
| Method | Carrier quantity varied by the message | Carrier quantity ideally held constant |
|---|---|---|
| Amplitude modulation (AM) | Amplitude | Frequency |
| Frequency modulation (FM) | Frequency | Amplitude |
AM has a simpler receiver but is more affected by amplitude noise. FM is less sensitive to amplitude noise, but uses more bandwidth and requires a different detector. The syllabus requires the concepts and waveforms, not mathematical derivations.
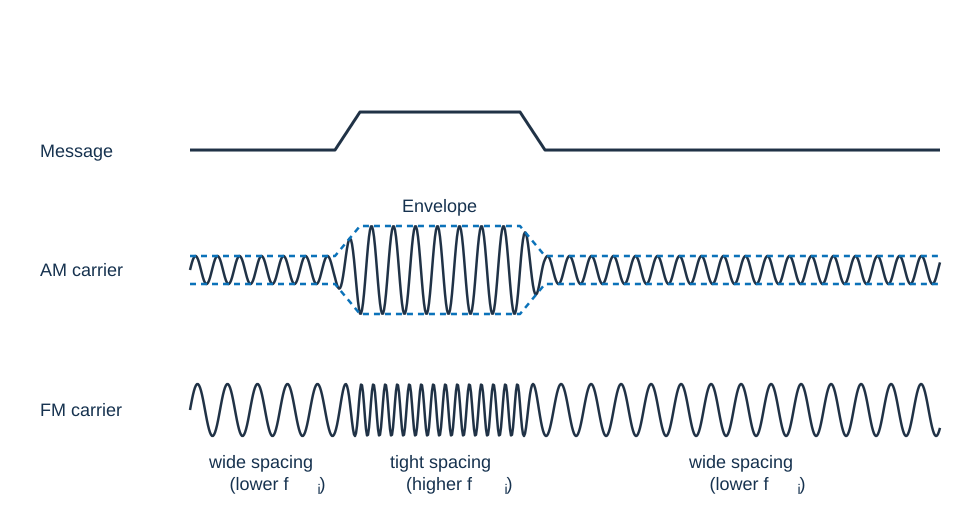
In AM, the upper and lower envelopes follow the message, while carrier-cycle spacing stays fixed. If the message is too large for the carrier, the envelope is overmodulated and distorted.
In FM, carrier amplitude stays approximately fixed while instantaneous frequency varies around the carrier frequency.
| Exam point | AM | FM |
|---|---|---|
| Quantity varied | Carrier amplitude | Instantaneous carrier frequency |
| Carrier amplitude | Changes with the message | Ideally constant |
| Noise response | Amplitude noise directly affects the envelope | Less sensitive to amplitude noise |
| Bandwidth | Narrower than FM for a given message | Wider; depends on peak deviation and message frequency |
| Demodulator | Envelope detector for conventional AM | FM detector |
Superheterodyne radio receiver
A superheterodyne receiver converts a selected radio-frequency signal to a fixed intermediate frequency (IF), where amplification and filtering are easier.
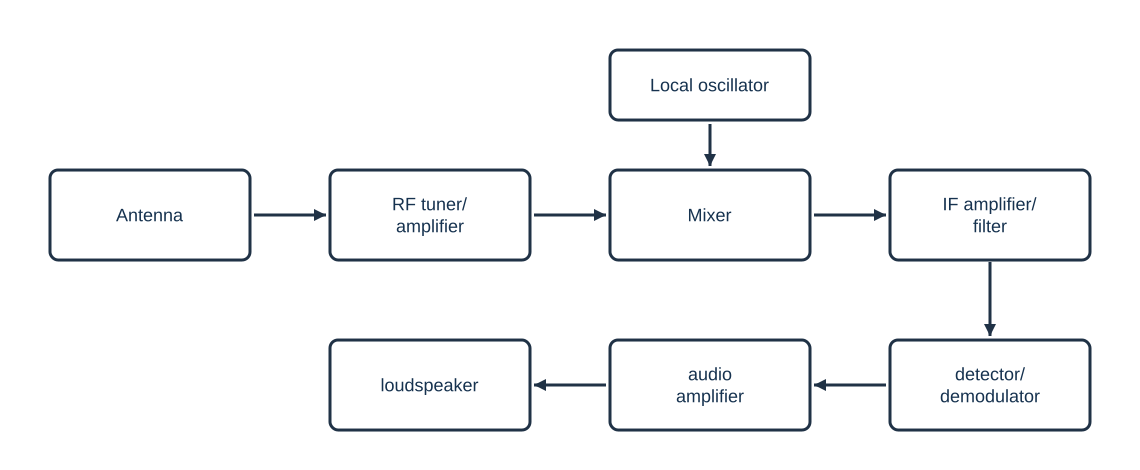
The tuner selects the desired station. The mixer combines it with the local-oscillator signal; the selected difference frequency is . The local oscillator tracks the tuned station so the IF remains fixed. The IF stage provides most of the receiver's gain and selectivity. The detector recovers the audio message: an envelope detector is commonly used for AM, while an FM detector is used for FM. The audio amplifier drives the output transducer.
AM superheterodyne receiver
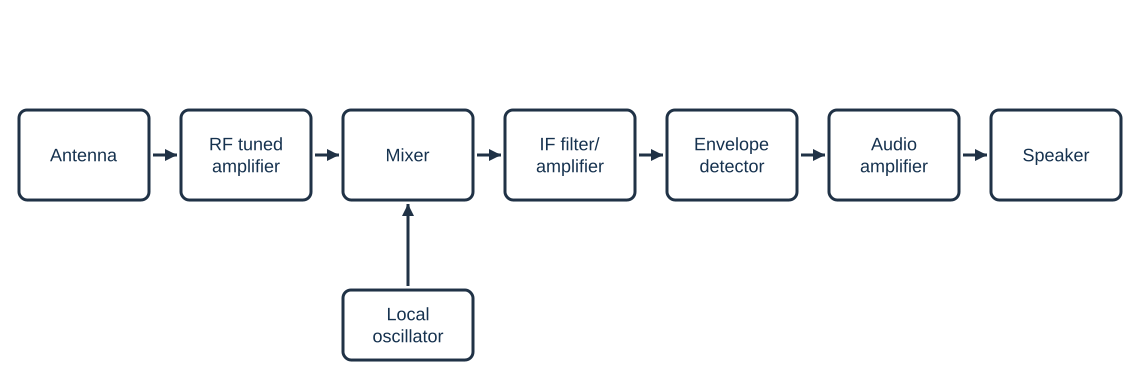
The envelope detector follows the AM carrier's envelope to recover the message.
FM superheterodyne receiver
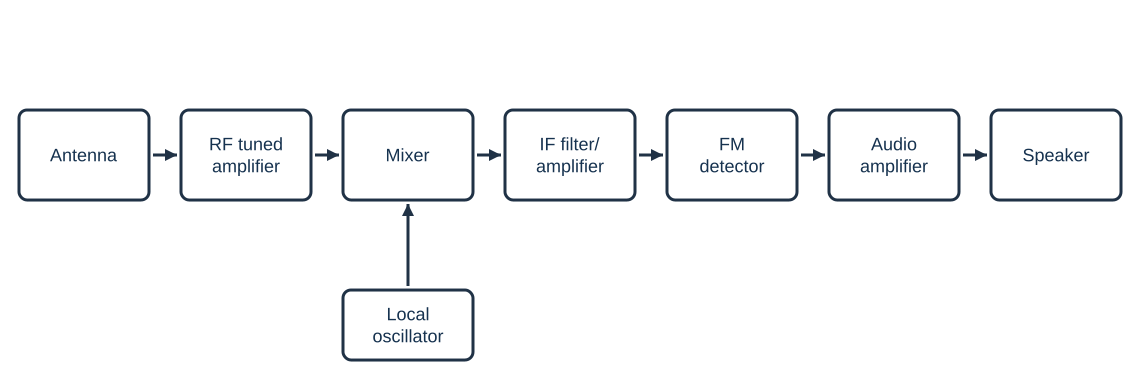
The AM envelope detector and the FM detector are different demodulators; do not interchange them.
Wired and Wireless Communication
In wired communication, a guided medium such as twisted-pair cable, coaxial cable, or optical fiber confines the signal. It can provide predictable links and physical security, but installation requires a path for the cable.
In wireless communication, an antenna radiates and receives electromagnetic waves through free space. It supports mobility and broad-area access, but propagation loss, interference, obstacles, and shared spectrum affect performance.
| Comparison | Guided (wired) link | Wireless link |
|---|---|---|
| Medium | Copper cable or optical fiber | Free space, using radio or optical waves |
| Mobility | Endpoint usually tied to the cable route | Supports mobile endpoints within coverage |
| Interference | Shielding and medium choice can limit interference | Susceptible to co-channel interference, fading, and obstacles |
| Installation | Requires cable, connectors, and a physical route | Requires antennas, access points/base stations, and spectrum planning |
| Examples | Ethernet over twisted pair; fiber backbone | Wi-Fi, cellular radio, Bluetooth |
Fiber-optic communication system
A fiber-optic link converts an electrical message to light, guides the light through an optical fiber, then converts it back to an electrical signal.
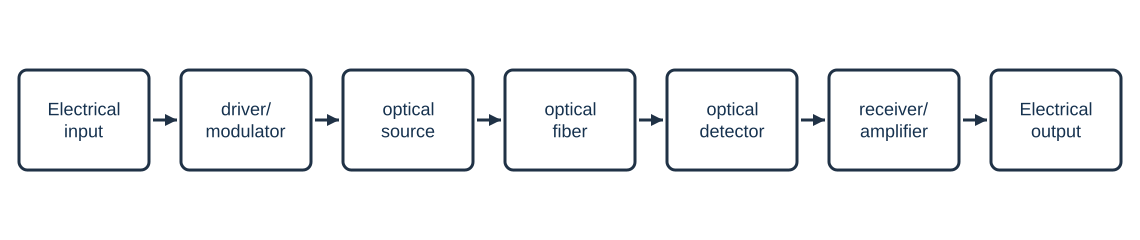
The transmitter drives the optical source. The fiber guides the optical signal, and the receiver converts the received light back into an electrical signal. Optical links offer high bandwidth and are not affected by electromagnetic interference in the same way as copper conductors.
GSM architecture
The Global System for Mobile Communications (GSM) separates the mobile radio access network from its switching equipment.
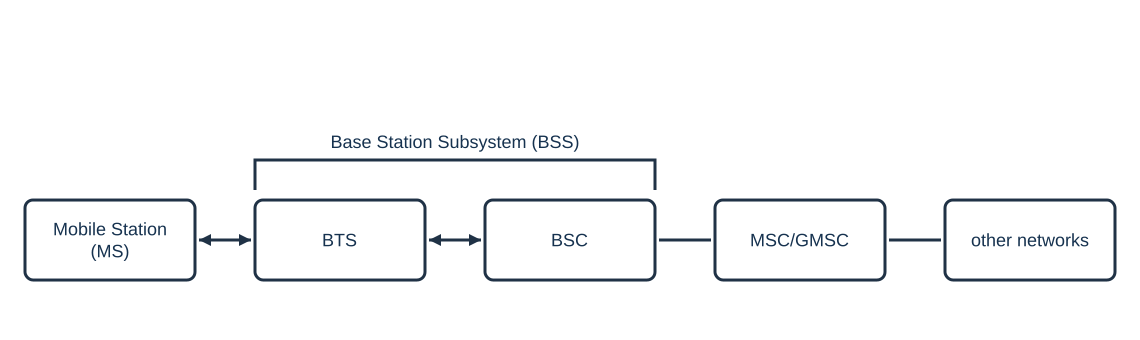
- MS: handset and SIM used by the subscriber.
- BTS: radio equipment that communicates with mobiles in a cell.
- BSC: controls a group of BTSs and radio-channel allocation; together BTS and BSC form the BSS.
- MSC/GMSC: switches calls and connects the mobile network to other networks.
The MS connects over the radio path to the BTS and BSC, which together form the BSS; the MSC/GMSC switches calls and provides the gateway to other networks.
Mobile-network generations
| Generation | Main development | Typical capabilities emphasized in an introductory comparison |
|---|---|---|
| 3G | Digital mobile broadband beyond voice and basic data | Mobile internet, video calling, and packet data |
| 4G | All-IP broadband | Higher data rates, lower latency than 3G, and multimedia services |
| 5G | Flexible radio and core network design | Enhanced mobile broadband, low-latency services, and support for many connected devices |
| 6G | Research and future development beyond 5G | Further improvements in capacity and latency are under study; capabilities remain under development |
3G emphasizes mobile packet data and multimedia; 4G uses an all-IP broadband architecture; 5G adds flexible radio deployments and service classes for broadband, low-latency, and large-scale device connectivity. 6G remains a research and standardization direction rather than a deployed commercial generation in this syllabus overview.
These labels describe broad technology generations; actual performance depends on the deployment, spectrum, device, and network configuration.
Electronic Instrumentation
An electronic instrument converts a physical quantity into a readable measurement. A general measurement chain is:
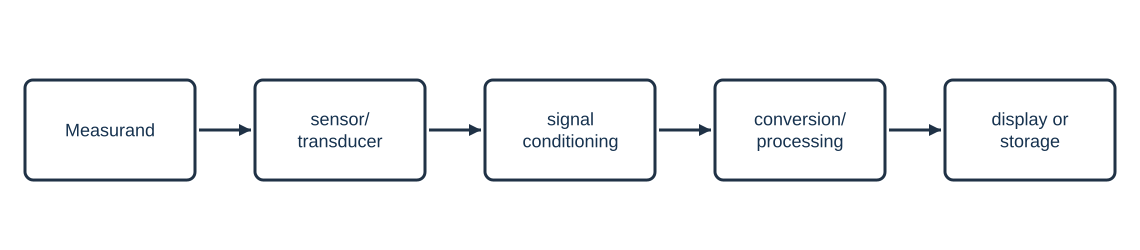
The sensor responds to the quantity being measured. Signal conditioning may amplify, filter, linearize, or isolate the signal; a converter or processor then scales the result into useful units. The output stage displays, records, or transmits the measurement.
Digital multimeter (DMM)
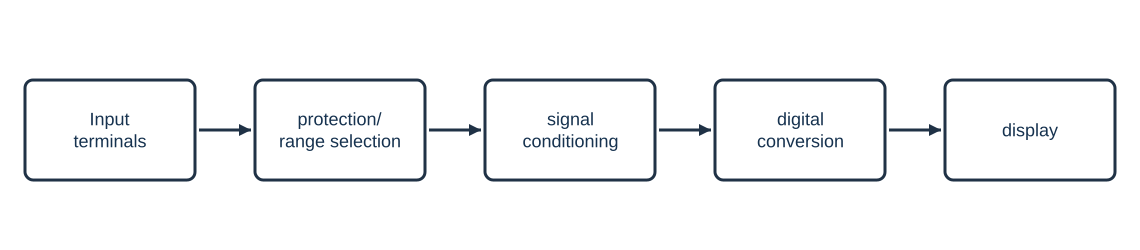
A DMM measures quantities such as voltage, current, and resistance. Its input is protected and its range selected, the signal is conditioned, and the result is converted to digital form for the display.
Function generator
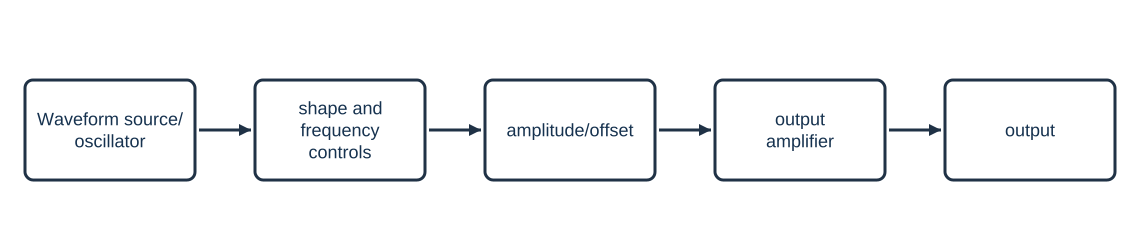
A function generator produces test waveforms such as sine, square, and triangular waves. A waveform source or oscillator establishes shape and frequency; amplitude and offset controls set the output level, and an output stage provides the output signal.
Cathode-ray oscilloscope (CRO)
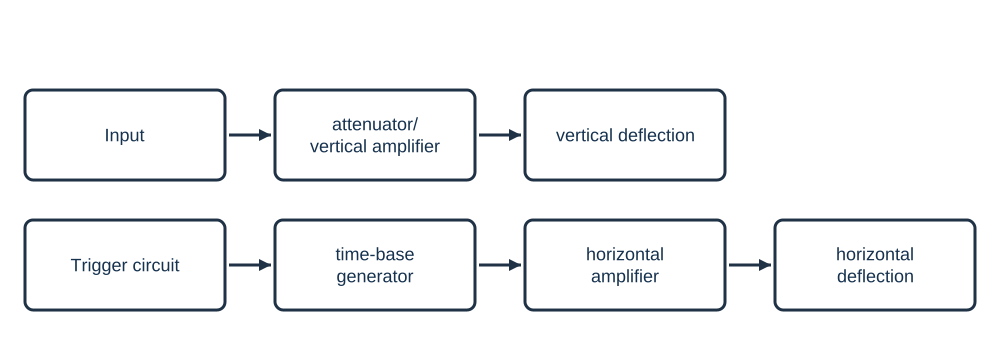
A CRO displays voltage against time. The vertical system conditions the input signal; the time-base and horizontal system sweep the trace across the screen; the trigger stabilizes a repeating waveform. The display lets an observer compare amplitude, period, phase, and waveform shape.
In X-Y mode, one periodic signal drives the horizontal input and another drives the vertical input. The resulting Lissajous pattern can compare their frequencies and phase. For equal frequencies, the trace is a straight line or ellipse; its shape and direction of travel indicate the phase difference.
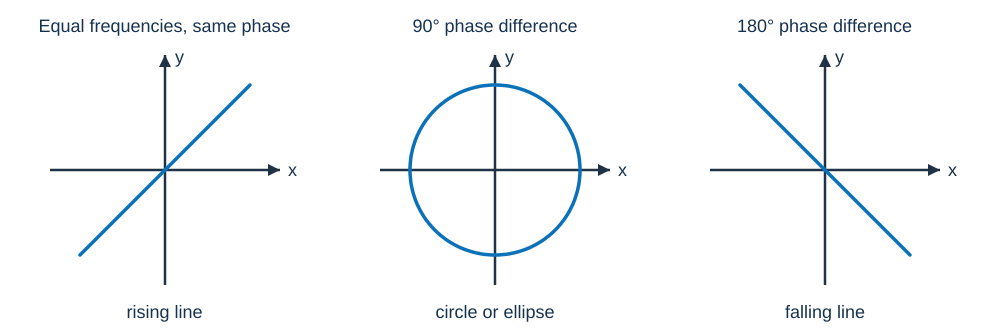
For equal amplitudes, the 90° pattern is a circle; unequal amplitudes produce an ellipse. These shapes assume stable sinusoidal inputs of equal frequency.
IoT Applications: Case Studies
An Internet of Things system connects sensors and actuators to a local controller or network service. A simple architecture is:
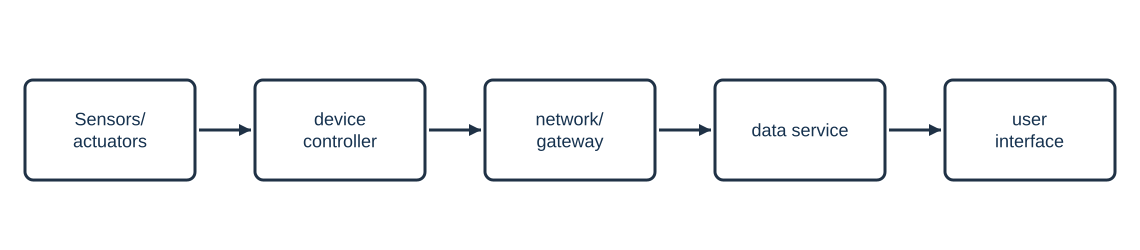
The design must consider power, connectivity, data privacy, security, and what happens when the network is unavailable.
For each case study, identify the measurand, sensor, controller or gateway, communication/data service, decision rule, and actuator or user alert. Then state one practical limitation and one safeguard; this shows both the IoT block flow and how the system behaves in use.
Smart home
Case: A temperature sensor reports room conditions to a controller. If the measured temperature crosses a configured threshold, the controller signals a relay to switch heating or cooling. Door sensors, lighting, and energy meters can send status to a local hub or user interface. The design needs authenticated access, protected device updates, and a local override so essential controls still work during a network outage.
Healthcare
Case: A wearable or bedside sensor measures a quantity such as pulse rate and sends time-stamped readings to a nearby monitor or authorized clinical system. A threshold can flag a reading for review, but a sensor reading alone is not a diagnosis. The system must handle sensor detachment, poor contact, connectivity loss, false alarms, and privacy of health data; alerts should be reviewed by qualified staff.
Agriculture
Case: Soil-moisture sensors and a weather or temperature input report field conditions to a controller. When moisture falls below a chosen threshold, the controller can operate a pump or valve; readings and water use can be shown to a farmer remotely. Sensor placement, calibration, power and network availability, water limits, and a safe manual override determine whether the system is useful.
These are case studies of sensing, communication, and control; they do not replace professional medical or agricultural judgment.